Picture this: You’ve just received a hefty year-end bonus, or maybe an inheritance check just cleared. You’re staring at your bank account, and the number looks good. But then the anxiety hits.
Do you dump it all into the market right now? Or do you trickle it in slowly, month by month?
It’s the classic “SIP vs Lump Sum” debate, and in 2026, with market volatility higher than we’ve seen in the last decade, getting this wrong can cost you. I’ve seen investors lose 15% of their capital in a month because they mistimed a lump sum. I’ve also seen others miss out on massive rallies because they were too cautious with a drip-feed SIP.
Here’s the truth: Math doesn’t lie, but emotions do. In this guide, we’re going to use the SIP vs lump sum calculator logic to strip away the fear and look at the raw numbers. We’ll cover which strategy fits your specific financial DNA and how to navigate the current 2026 economic climate.
📑 What You’ll Learn
The Core Concepts: SIP vs. Lump Sum Defined
Before we plug numbers into any tool, let’s get our definitions straight. Think of investing like filling a swimming pool.
Lump Sum is backing up a water truck and dumping 10,000 gallons in at once. You’re in the pool immediately. If the weather is sunny (a Bull Market), you enjoy the swim from day one. If a storm hits (a Bear Market), you’re stuck in the rain with no cover.
SIP (Systematic Investment Plan) is using a garden hose. You fill the pool gradually. It takes longer to get the full volume in, but if a storm hits, you can pause or adjust. More importantly, you aren’t betting everything on today’s weather.
🎯 Key Takeaway
Lump Sum investing is about maximizing time in the market, making it high-risk, high-reward. SIP investing is about managing risk through averaging, making it the defensive choice for volatile markets.
The Math: How the Calculator Actually Works
When you use a SIP vs lump sum calculator, you aren’t just predicting the future; you are modeling probability. Most investors look at the final number, but the process is where the magic happens.
The calculator relies on three critical levers:
- Compounding Frequency: Lump sums compound on the entire principal from Day 1. SIPs compound on a staggered basis. The first installment compounds for 10 years; the last one only for a month.
- Rupee/Dollar Cost Averaging: This is the SIP superpower. When the market dips, your fixed monthly amount buys more units. When the market peaks, you buy fewer. This naturally lowers your average cost per unit over time.
- Sequence of Returns Risk: This is the danger zone for lump sums. If the market crashes 20% the day after you invest, your portfolio needs a 25% gain just to break even. A calculator helps you visualize this “recovery period.”
Head-to-Head: The Ultimate Comparison
Let’s break this down. I’ve analyzed data from the last two market cycles to create this comparison matrix. This isn’t theory; this is how these strategies behave in the wild.
| Feature | Systematic Investment Plan (SIP) | Lump Sum Investment |
|---|---|---|
| Best For | Salaried individuals with monthly cash flow. | Windfalls (Bonus, Inheritance, Property Sale). |
| Market Timing | Irrelevant. You invest regardless of market levels. | Critical. Investing at a peak can hurt returns for years. |
| Psychological Stress | Low. It’s automated and “set-and-forget.” | High. You constantly worry if you entered at the “right” price. |
| Risk Level | Low to Moderate (spreads risk over time). | High (immediate exposure to market swings). |
| Power of Compounding | Gradual. Back-loaded towards the end of the tenure. | Immediate. Front-loaded on the entire capital. |
💡 Pro Tip: The “STP” Hack
Got a lump sum but terrified of a market crash? Don’t let the cash sit in a savings account. Use a Systematic Transfer Plan (STP). Put the lump sum into a Liquid Fund (low risk) and instruct the fund house to transfer a fixed amount weekly into an Equity Fund. You get the stability of a SIP with the capital availability of a Lump Sum.
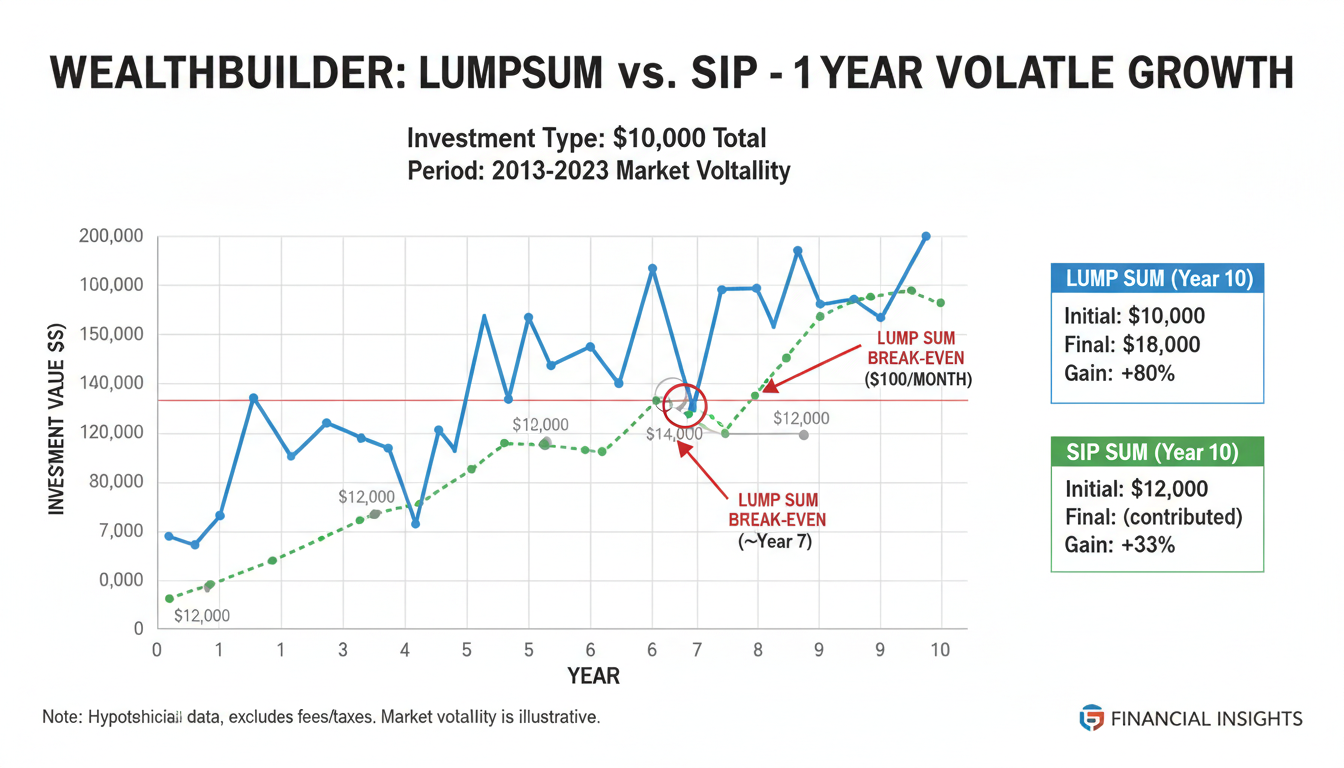
Real-World Scenarios: Bull vs. Bear Markets
This is where the rubber meets the road. Let’s run a simulation. Imagine you have $12,000 to invest in 2026.
Scenario A: The Bull Run (Market goes up steadily)
If the market rises 12% consistently this year:
- Lump Sum ($12k on Jan 1): The entire amount grows by 12%. You win big.
- SIP ($1k/month): Only the first $1k gets the full year’s growth. The last $1k only grows for a month. The Lump Sum beats the SIP by a significant margin here.
Scenario B: The Volatile Correction (Market crashes then recovers)
This is the 2026 reality for many sectors. The market drops 15% in the first 6 months, then recovers.
- Lump Sum: Your $12k drops to $10,200. You panic. You need a massive rally just to get back to zero.
- SIP: You are cheering. Why? Because during those 6 months of crashing prices, your $1,000 monthly installments are buying more units at “sale” prices. When the recovery happens, your portfolio value rockets past the lump sum because you own more units.
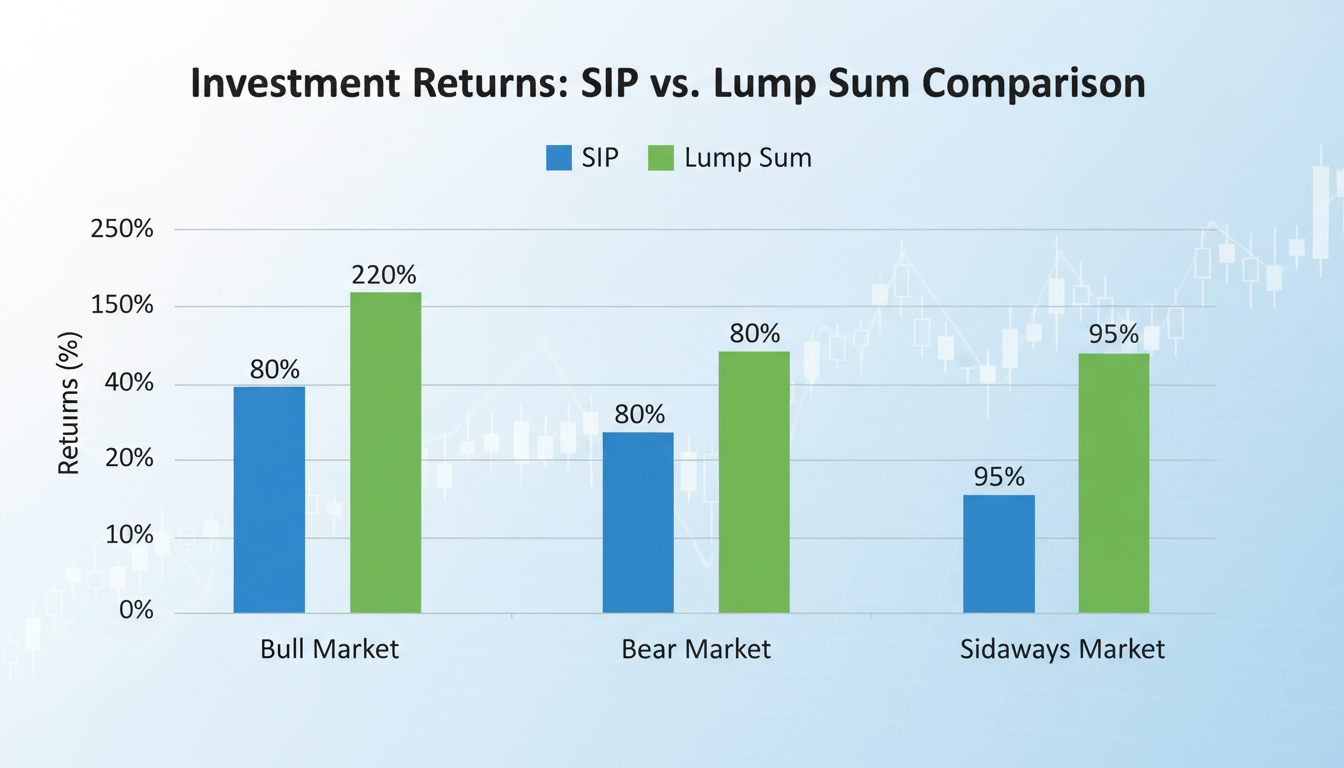
| Market Phase | Winner | Why? |
|---|---|---|
| Steady Bull Market | Lump Sum | Full capital participates in the rally immediately. |
| Bear Market / Crash | SIP | Accumulates more units at lower prices (Cost Averaging). |
| Sideways / Volatile | SIP | Reduces volatility and smooths out the purchase price. |
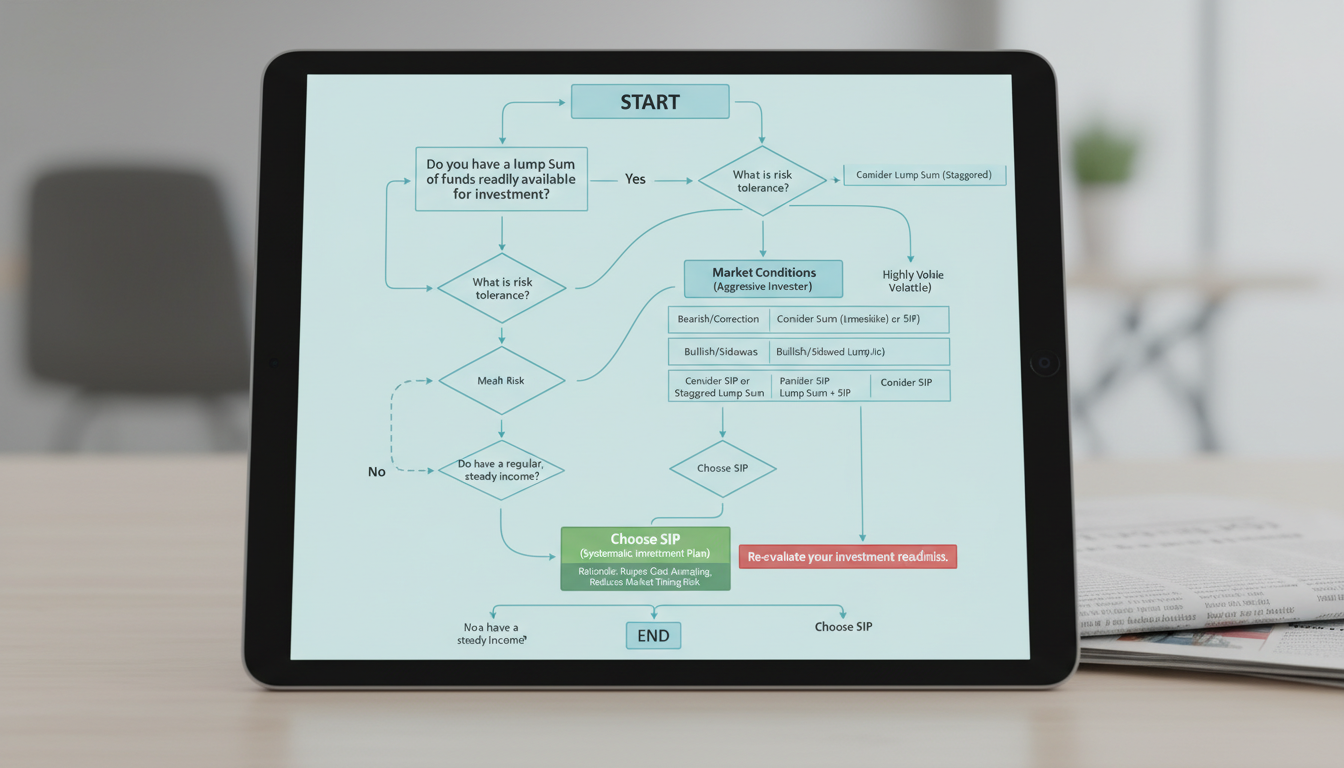
Step-by-Step: How to Execute Your Strategy
So, you’ve looked at the SIP vs lump sum calculator results and made a choice. How do you actually pull the trigger without messing up?
- Audit Your Liquidity: Before investing a lump sum, ensure you have an emergency fund (6 months of expenses) set aside. Never invest emergency cash in equities.
- Check Valuations (For Lump Sums): Look at the P/E (Price to Earnings) ratio of the index. According to Investor.gov, buying when the P/E is historically high increases your risk of short-term losses. If the market feels “expensive,” split your lump sum into 3-4 tranches.
- Automate the SIP: Set your SIP date for 1-2 days after your salary hits. Don’t leave it to manual transfers. Discipline beats intelligence in investing.
- Review Annually: Don’t check your portfolio daily. In 2026, daily swings are noise. Check once a year to rebalance.
⚠️ Watch Out
The “Stop-SIP” Trap: The biggest mistake investors make is stopping their SIP when the market crashes. This is financial suicide. A crash is the best time for a SIP because you are buying cheap. Stopping now destroys the averaging benefit.
The Expert Verdict: When to Use Which
After advising clients through the 2020 crash and the subsequent rallies, here is my honest take on how to decide.
Choose SIP if:
- You are investing from your monthly salary.
- You are a new investor and market drops make you nervous.
- You have a long-term horizon (10+ years) but limited upfront capital.
Choose Lump Sum if:
- You have a large idle cash pile (bonus, inheritance) earning nothing in the bank.
- The market has recently corrected (dropped 10-20%)—this is a “buy the dip” opportunity.
- You are an experienced investor who understands that Vanguard research historically favors lump sum investing about 68% of the time purely on a mathematical basis.
Conclusion
There is no single “best” method, only the method that lets you sleep at night. The SIP vs lump sum calculator is a fantastic tool to model scenarios, but it can’t model your emotions.
If you have the cash and the stomach for risk, a lump sum (or STP) mathematically wins most of the time. But if you want a stress-free, disciplined path to wealth that turns market volatility into your friend, the SIP is the undisputed king.
The year 2026 offers unique opportunities. Don’t get paralyzed by analysis. The worst investment strategy is the one you never start. Pick a lane, stick to the plan, and let compounding do the heavy lifting.
❓ Frequently Asked Questions
Is SIP safer than Lump Sum in 2026?
Generally, yes. Given the current economic volatility in 2026, SIPs reduce the risk of entering the market at a peak. They smooth out the purchase price over time, protecting you from sudden market corrections.
Can I do both SIP and Lump Sum in the same fund?
Absolutely. This is often the best strategy. You can maintain a monthly SIP for discipline and inject a Lump Sum whenever you receive a bonus or when the market dips significantly.
What is a Step-Up SIP?
A Step-Up SIP is a feature where you instruct the fund to increase your SIP amount by a fixed percentage (e.g., 10%) every year. This aligns your investments with your salary hikes and fights inflation effectively.
How does taxation differ between the two?
In many jurisdictions, capital gains tax is based on the holding period. For a Lump Sum, the clock starts once. For SIPs, each installment is treated as a fresh investment with its own start date. You need to be careful when redeeming to ensure all units have completed the required holding period to avoid short-term taxes.
Does the calculator account for inflation?
Most basic calculators show “nominal” returns (the raw number). To see your “real” purchasing power, you should look for calculators that allow you to input an inflation rate, or mentally subtract 5-6% from the projected return.
For more detailed data on market trends, you can refer to reports from Morningstar regarding fund performance in the current year.

