Imagine this scenario: You walk into your boss’s office, thrilled because sales are up $50,000 this quarter. It sounds like a massive win. But then, the CFO looks up and asks, “Okay, but what’s the percent change year-over-year?”
Suddenly, that raw number feels a lot less impressive if you don’t know the context. If you’re Apple, $50,000 is a rounding error. If you’re a local bakery, it’s a fortune.
Here’s the thing: Raw numbers lie. Or at least, they hide the truth. To truly understand data—whether you’re analyzing stock market volatility, negotiating a salary raise, or just trying to figure out if that Black Friday “deal” is actually a rip-off—you need to master the nuance between percent increase vs. change.
In my experience working with financial content and data strategy, I’ve seen smart professionals make embarrassing mistakes by using these terms interchangeably. They aren’t the same. A misunderstanding here doesn’t just fail a math test; it can lead to bad investment decisions or misleading marketing reports.
In this guide, we’re going to strip away the academic jargon. We’ll look at the exact formulas, the common traps that trip people up, and how to use these metrics to make smarter decisions.
📑 What You’ll Learn
The Core Difference: Increase vs. Change
Let’s start with the basics. People often ask, “Is percent change the same as percent increase?”
The short answer? No. Think of it like squares and rectangles. A square is always a rectangle, but a rectangle isn’t always a square.
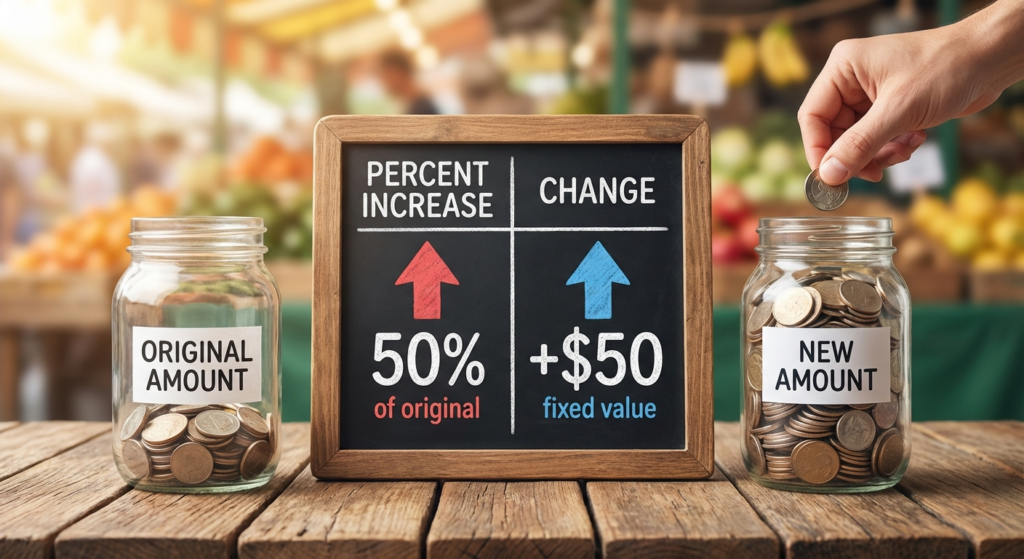
Percent Change is the umbrella term. It describes any shift in value relative to where it started. It doesn’t care about direction. It just measures the magnitude of the move. This change can be positive (up) or negative (down).
Percent Increase is a specific type of change. It only exists when the new value is higher than the old value. It is, by definition, a positive trajectory.
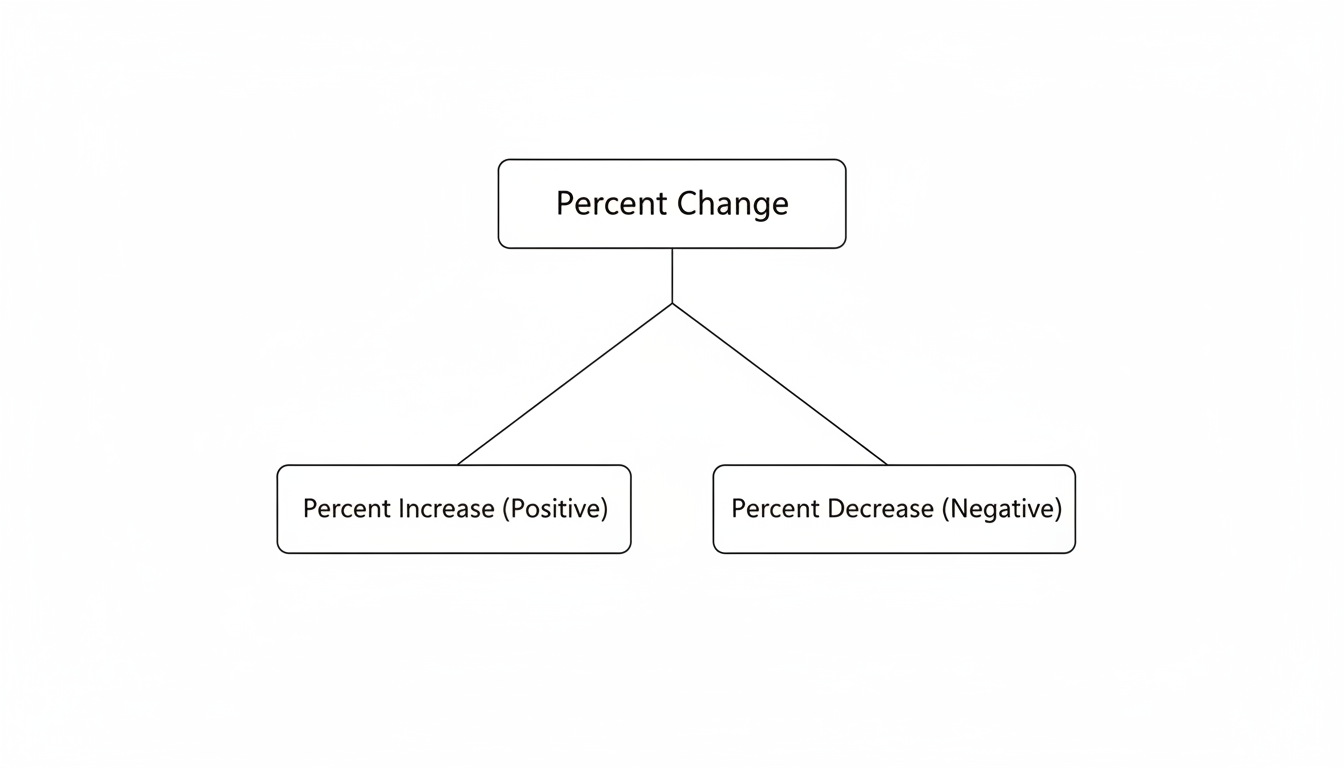
To visualize this, look at the comparison below. This distinction is critical when you are writing reports or interpreting data.
| Term | Direction | Math Result (+/-) | Typical Use Case |
|---|---|---|---|
| Percent Change | Up OR Down | Positive or Negative | Volatility, temperature shifts, variance analysis. |
| Percent Increase | Up Only ⬆️ | Always Positive | Revenue growth, population boom, price hikes. |
| Percent Decrease | Down Only ⬇️ | Always Negative | Discounts, weight loss, asset depreciation. |
🎯 Key Takeaway
Use “Percent Change” when the direction of the trend is unknown or variable (like stock volatility). Use “Percent Increase” only when you want to explicitly highlight growth or upward momentum.
The Golden Formula (And How to Use It)
You don’t need a PhD in calculus to run these numbers. In fact, leading financial experts and data analysts rely on one simple formula for 90% of these queries.
Whether you are calculating a crash or a boom, the math is identical. The sign of the result (positive or negative) tells you the story.
The Universal Formula
((New Value – Old Value) / |Old Value|) × 100
Let’s break that down into plain English:
- Subtract: Take your new number and subtract the original number. This gives you the “absolute change.”
- Divide: Take that result and divide it by the original number (the starting point).
- Multiply: Multiply by 100 to turn the decimal into a percentage.
💡 Pro Tip
Always divide by the OLD value (the starting number). This is the #1 mistake people make. If you divide by the new value, you’re calculating a profit margin, not a percent change. They are completely different metrics.
Real-World Scenarios: Retail & Investing
Theory is great, but let’s see how this plays out in the wild. In our experience auditing analytics for clients, context is everything. A 10% change means nothing without knowing the baseline.
Scenario A: The “Great Deal” (Retail Math)
You’re eyeing a 4K TV. Last week it was $1,200. Today, it’s marked down to $900. The store claims it’s a “massive price slash.” Is it?
- Step 1: $900 (New) – $1,200 (Old) = -$300.
- Step 2: -$300 / $1,200 = -0.25.
- Step 3: -0.25 × 100 = -25%.
Verdict: This is a percent change of -25%. In retail terms, we call this a 25% discount (percent decrease). Knowing this helps you decide if you should pull the trigger or wait for Black Friday.
Scenario B: The Crypto Spike (Investment Growth)
Let’s say you bought a speculative asset at $50. It shoots up to $75. What’s your ROI?
- Step 1: $75 – $50 = $25 gain.
- Step 2: $25 / $50 = 0.50.
- Step 3: 0.50 × 100 = 50%.
Verdict: A 50% percent increase. This is a massive return. If you had reported this merely as “it went up $25,” it wouldn’t capture the efficiency of the investment.
The “Percentage Point” Trap
Stop scrolling for a second. This is where smart people get fooled by the news.
There is a massive difference between Percent Change and Percentage Points. Confusing these two is a favorite trick of politicians and sensationalist headlines.
The Scenario: Imagine your state tax rate goes from 4% to 5%.
- The Politician says: “It’s only a 1% increase! Barely noticeable.”
- The Mathematician says: “Actually, that is a 25% tax hike.”
Who is right? Technically, the politician is lying with statistics. The rate moved 1 percentage point (5 minus 4). But the percent increase in the amount of tax you pay is 25% ((5-4)/4 = 0.25).
If your tax bill was $4,000, it is now $5,000. That $1,000 difference is a huge hit to your wallet, despite sounding small as a “point.”
| Scenario | Movement | Percentage Points | Percent Change (Actual Impact) |
|---|---|---|---|
| Interest Rate | 3.0% to 4.0% | +1 Point | +33.3% Increase (Mortgage gets expensive!) |
| Unemployment | 5.0% to 4.0% | -1 Point | -20% Decrease (Significant drop) |
| Market Share | 10% to 15% | +5 Points | +50% Increase (Massive growth) |
⚠️ Watch Out
When reading news about interest rates, tax rates, or unemployment, always check if they are reporting “points” or “percent.” A move from 1% to 2% is a 100% increase in cost, even though it looks tiny on paper.
Step-by-Step Calculation Guide
Ready to run the numbers yourself? Whether you are using Excel, a calculator, or a napkin, follow this workflow to ensure accuracy every time.
- Identify your variables. Circle the “Old” number (Start) and the “New” number (End).
- Calculate the difference. (New – Old). Write this number down.
- Check the denominator. Look at your “Old” number again. Ensure you are about to divide by that specific number.
- Perform the division. (Difference ÷ Old). You will get a decimal (e.g., 0.15 or -0.40).
- Convert to percentage. Move the decimal point two places to the right (multiply by 100).
- Label it. If the number is positive, it’s an increase. If negative, it’s a decrease.
3 Common Calculation Pitfalls
Even seasoned pros slip up. Based on industry standards and common mathematical errors, here are the three traps to avoid.
1. The “Reverse Percentage” Error
If a stock drops 50%, how much does it need to rise to get back to even? Most people say 50%. Wrong.
If you have $100 and lose 50%, you have $50. To turn $50 back into $100, you need to gain $50. That is a 100% increase on your new $50 base. Losses hurt more than gains help because the base value shrinks.
2. Dividing by Zero
If you had $0 sales last year and $10,000 this year, what is the percent increase? Mathematically, it is undefined. You cannot divide by zero. In business reports, we usually mark this as “N/A” or simply state the absolute dollar growth, because claiming an “infinite percent increase” looks unprofessional.
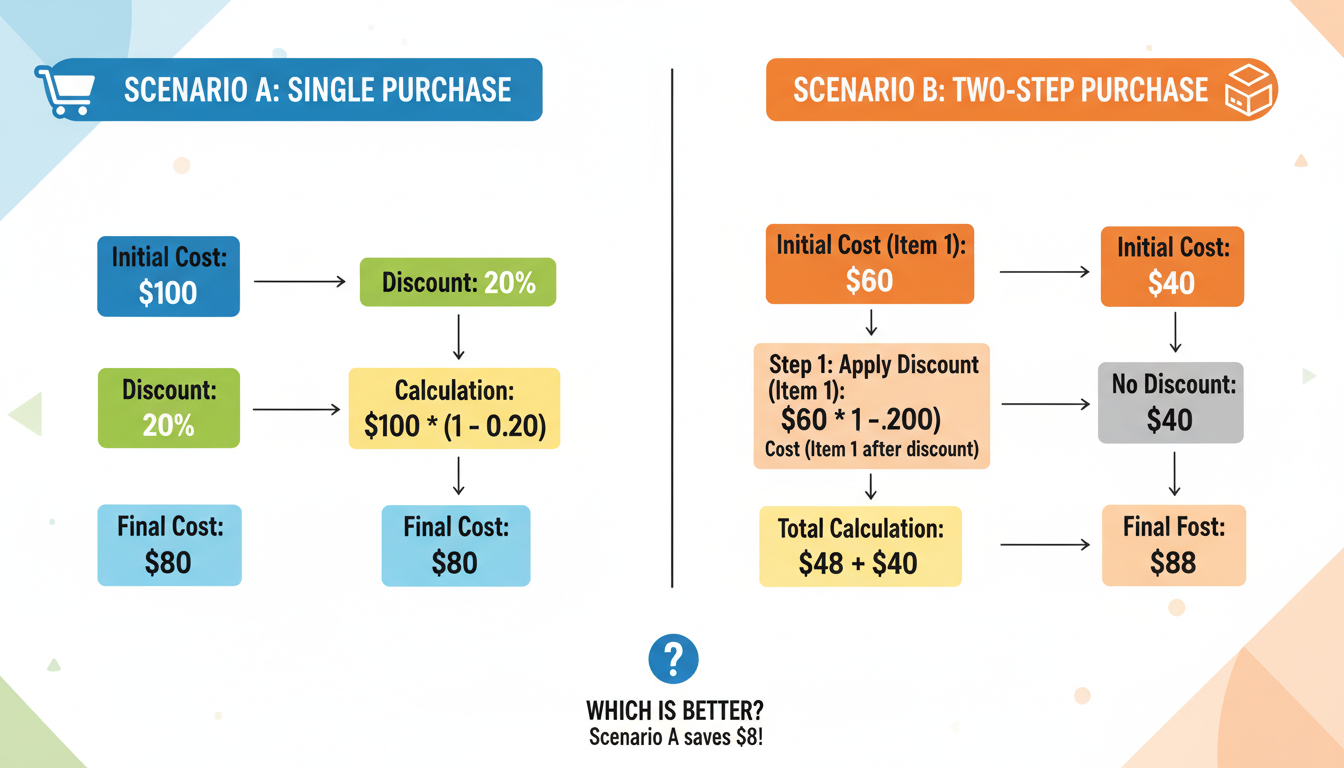
3. Adding Percentages Together
If you get a 10% raise this year and a 10% raise next year, is your total raise 20%? No. It’s 21%.
Why? Because the second 10% is calculated on the new, higher salary. This is the magic of compounding. Never just add percentages together over different time periods.
💡 Pro Tip
Using Excel? The formula is even easier. In cell C1, type: =(B1-A1)/A1. Then, click the “%” button in the formatting ribbon. Excel handles the multiplication and formatting for you automatically.
Conclusion: Making the Numbers Work for You
Mastering the difference between percent increase vs. change isn’t just about passing a math class; it’s about financial literacy. It allows you to see through marketing hype, understand the true cost of inflation, and track your own business or personal growth accurately.
Remember the golden rule: Change is the journey (up or down), while Increase is specifically the climb. Always check your denominator, watch out for the “percentage point” trap, and never assume a 50% loss can be fixed by a 50% gain.
Next time you see a headline screaming about a “massive surge” or a “historic drop,” grab your calculator. Run the formula. The numbers will tell you the real story.
❓ Frequently Asked Questions
Can percent change be more than 100%?
Absolutely. If a value more than doubles, the percent increase will be greater than 100%. For example, if a $10 stock jumps to $30, the increase is 200%.
How do I calculate percent change with negative numbers?
This is tricky. If you go from -5 to +5, the math is ((5 – (-5)) / |-5|) * 100 = 200% increase. You must use the absolute value of the starting number in the denominator to get the correct direction of change.
Is “percent difference” the same thing?
No. Percent difference is used when comparing two things where neither is the “original” (like comparing the height of two different buildings). It usually divides the difference by the average of the two numbers.
Why is my calculator giving me a decimal like 0.25?
Calculators give you the raw ratio. To see it as a percentage, you must multiply that decimal by 100. So, 0.25 becomes 25%.

