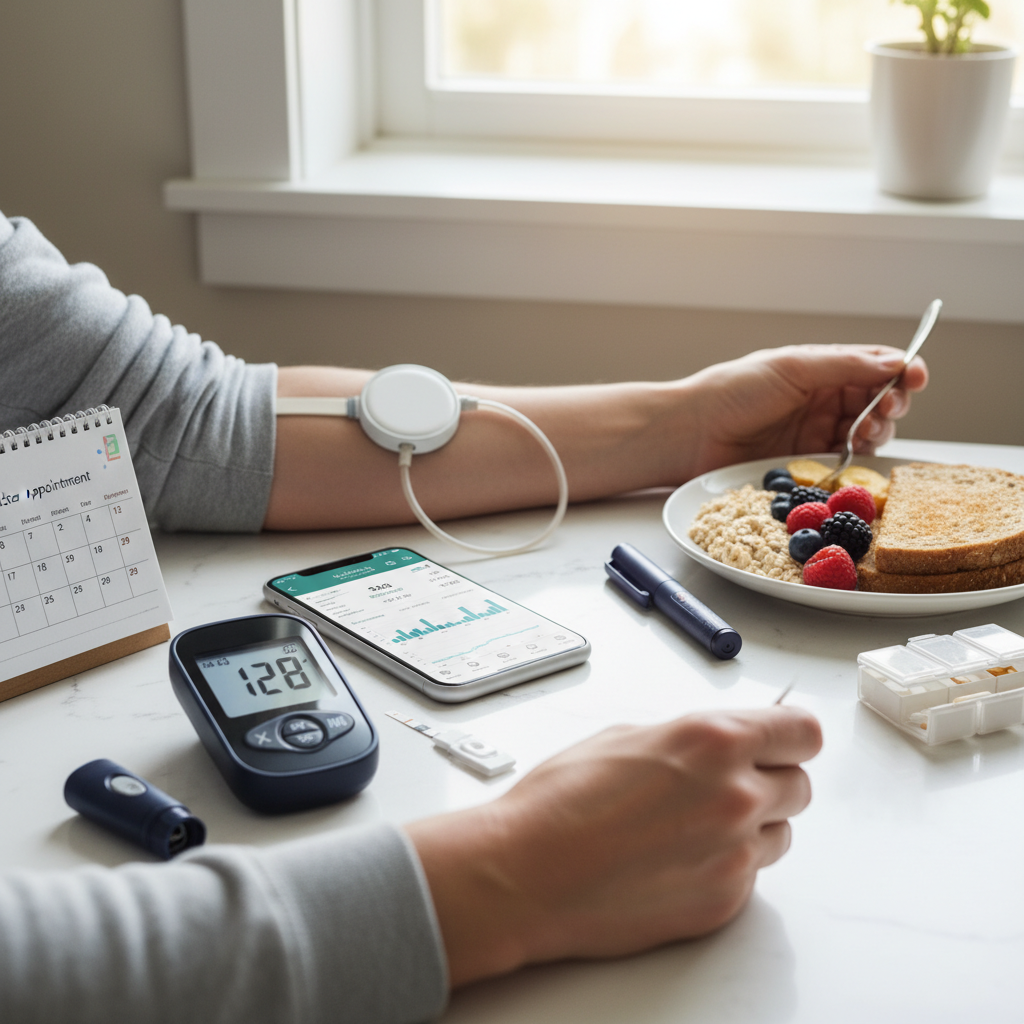
You’ve hit the big 5-0. Suddenly, your body isn’t playing by the same rules it did a decade ago. That slice of pizza that used to vanish without a trace? Now it seems to linger in your bloodstream—and on your waistline—a lot longer.
Here’s the reality: metabolism shifts gears when we cross the half-century mark. If you are managing diabetes or pre-diabetes, understanding your specific numbers is no longer optional. It’s the difference between feeling sluggish every afternoon and having the energy to enjoy your prime years.
But here is where it gets tricky. The “standard” charts you see online often apply to a generic 30-year-old. They don’t always account for the physiological changes, hormonal shifts, and safety margins required for someone over 50. In this guide, we’re going to break down the blood sugar level chart by age 50 for 2026, giving you the insider knowledge you need to take control.
📑 What You’ll Learn
The Metabolic Shift: Why 50 Changes Everything
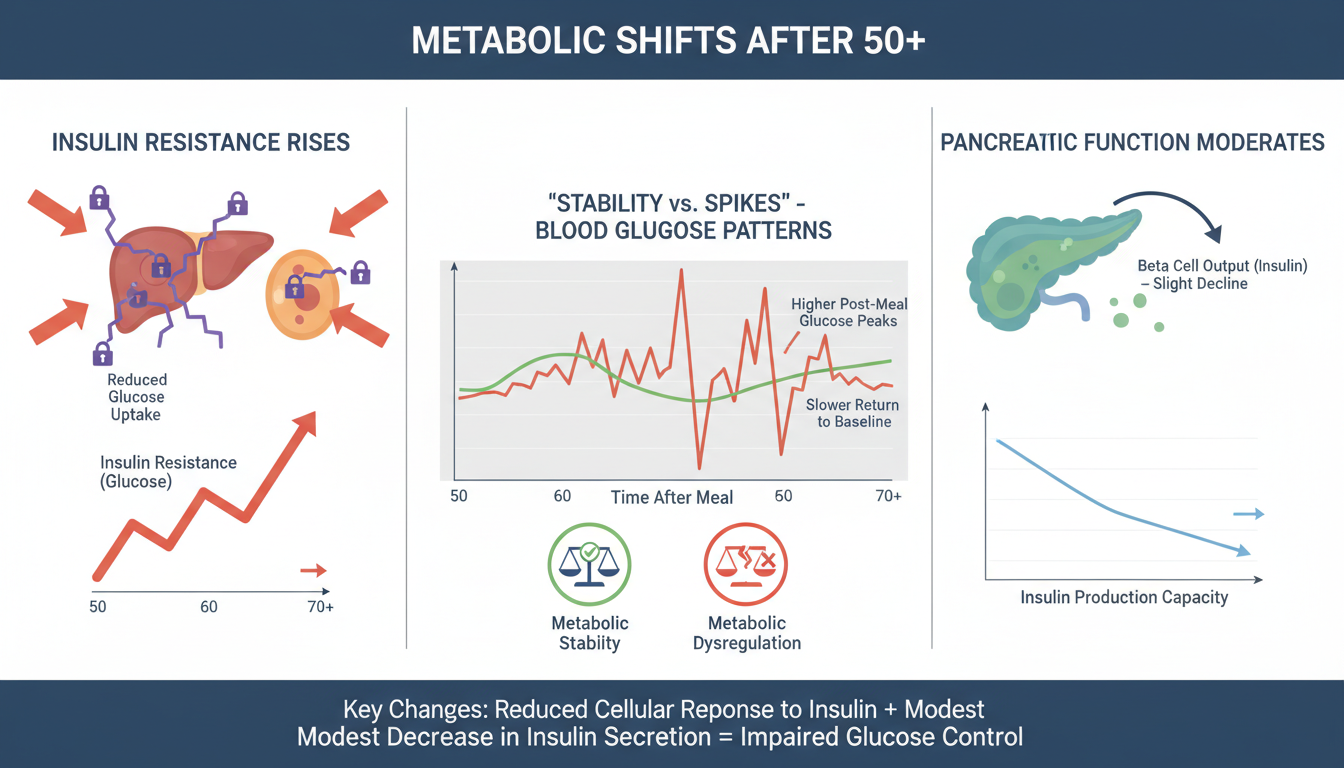
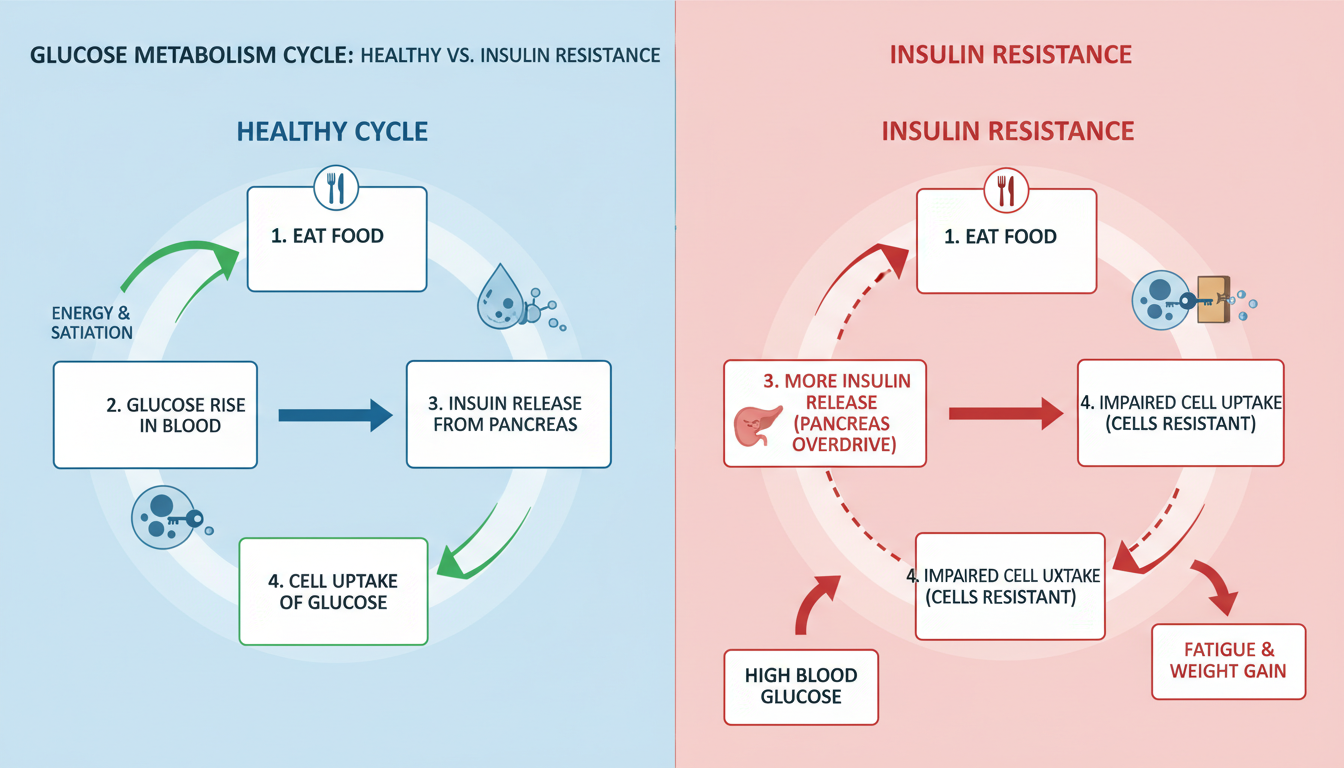
Let’s get technical for a second, but keep it simple. As we age, our pancreas (the organ responsible for insulin) doesn’t fire quite as rapidly as it used to. Simultaneously, our cells can become a bit more resistant to the insulin we do produce. It’s a double whammy.
In our experience working with mid-life health strategies, we see a common pattern: patients try to force their bodies to hit the same numbers they saw in their 30s. This often leads to burnout or dangerous lows. The goal after 50 isn’t just “low numbers”—it’s stability.
According to updated guidelines for 2026, medical professionals are prioritizing “Time in Range” (TIR) over occasional spikes. This means keeping your glucose steady for the majority of the day is more valuable than stressing over a single high reading after a birthday dinner.
The 2026 Blood Sugar Level Chart by Age 50
This is what you came for. Below is the breakdown of target ranges. Note that “Safe” ranges for those over 50 are slightly wider than for younger adults. Why? Because as we age, a blood sugar crash (hypoglycemia) is often more dangerous than a slight elevation.
Note: Always consult your endocrinologist for your specific targets.
| Category | Fasting (Morning) | 2 Hours Post-Meal | Bedtime |
|---|---|---|---|
| Non-Diabetic | 70 – 99 mg/dL | < 140 mg/dL | 100 – 120 mg/dL |
| Pre-Diabetic | 100 – 125 mg/dL | 140 – 199 mg/dL | 110 – 130 mg/dL |
| Diabetic (Well Controlled) | 80 – 130 mg/dL | < 180 mg/dL | 110 – 150 mg/dL |
| Diabetic (Complex Health*) | 90 – 150 mg/dL | < 200 mg/dL | 120 – 160 mg/dL |
🎯 Key Takeaway
If you are over 50, “perfect” isn’t always healthy. A fasting range of 80-130 mg/dL is often the sweet spot. It provides a safety buffer against dangerous lows while keeping long-term complications at bay.
Decoding the Data: A1C vs. Daily Readings
You might be checking your blood sugar every morning, but that number is just a snapshot. It tells you what’s happening right now. Your HbA1c (or just A1C) is the movie version—it tells the story of the last three months.
Many people get confused about how their daily meter readings translate to that percentage the doctor gives them. Let’s clear that up.
| A1C Percentage | Estimated Average Glucose (eAG) | Interpretation for Age 50+ |
|---|---|---|
| 6.0% | 126 mg/dL | Excellent control (Pre-diabetic range) |
| 7.0% | 154 mg/dL | The Gold Standard Target |
| 8.0% | 183 mg/dL | Acceptable for those with complications |
| 9.0% | 212 mg/dL | Action required (Medication adjustment likely) |
For a deeper dive into how A1C is calculated and what it means for your long-term health, the National Institute of Diabetes and Digestive and Kidney Diseases (NIDDK) offers comprehensive resources.
💡 Pro Tip: The “Dawn Phenomenon”
Do you wake up with high blood sugar even if you didn’t eat late? That’s the Dawn Phenomenon. Your body releases cortisol and growth hormones around 4:00 AM to wake you up, which dumps glucose into your blood. Don’t panic—it’s natural. A light, protein-rich snack before bed (like a handful of almonds) can sometimes help stabilize this.
⚠️ Watch Out: The Danger of “Going Low”
Here is something your doctor might not have emphasized enough. As we age, our body’s “alarm system” for low blood sugar starts to fade. In your 30s, if you dropped below 70 mg/dL, you’d shake, sweat, and feel anxious. By 50 or 60, you might not feel those symptoms until you are dangerously low—sometimes too low to help yourself.
This is called Hypoglycemia Unawareness.
⚠️ Watch Out
If you are taking insulin or sulfonylureas, never aim for fasting numbers below 80 mg/dL without strict medical supervision. The risk of a fall or fainting spell outweighs the benefit of “tight” control.
Modern technology has been a lifesaver here. Continuous Glucose Monitors (CGMs) are no longer just for Type 1 diabetics. Many insurance plans now cover them for Type 2s because they alert you before you crash. It’s like having a collision warning system for your metabolism.
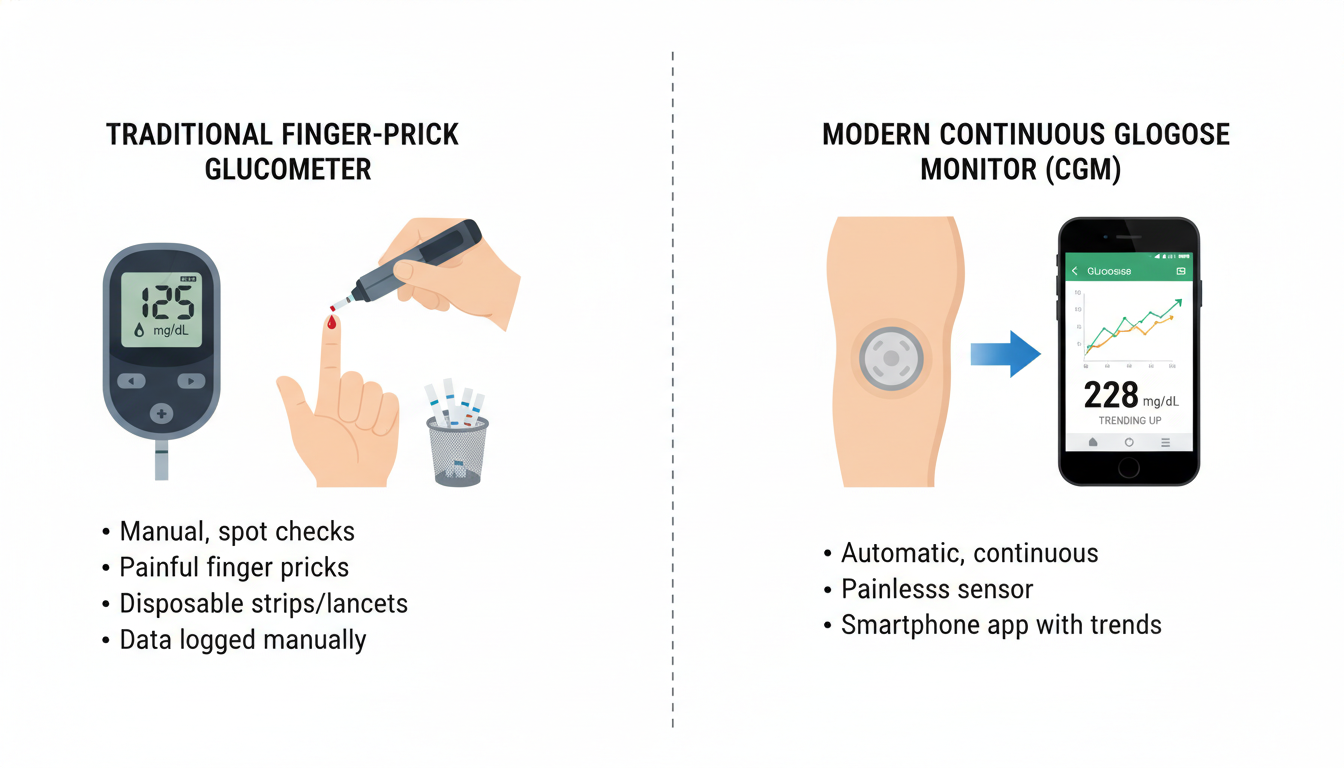
Step-by-Step: Mastering Your Monitoring Routine
If you aren’t using a CGM, you are likely relying on finger sticks. Believe it or not, many people do this wrong, leading to skewed data that messes up their blood sugar level chart by age 50 tracking.
Here is the clinical best practice for 2026:
- Wash with warm water: Alcohol swabs can dry out skin and actually dilute the blood sample if not fully evaporated. Warm water and soap are best.
- Use the side of the finger: The pad is where all the nerve endings are. Ouch. Use the side for less pain.
- Rotate fingers: Don’t abuse the same poor index finger. Rotate through all fingers to prevent calluses.
- Log the context: A number without context is useless. Did you just exercise? Did you eat pizza? Use a logbook or an app.
- Analyze trends, not instances: Look for patterns. Are you always high after lunch? That’s actionable data.
To help you make sense of these numbers, using a Diabetes Management Calculator can be incredibly helpful. It takes the guesswork out of how your food intake correlates with your readings.
Lifestyle Pillars: Beyond the Medicine Cabinet
Medication is the bridge, but lifestyle is the foundation. You can’t medicate your way out of a bad diet, especially after 50.
1. The Plate Method (Updated)
Forget weighing every gram of food. The most effective strategy we see working is the Plate Method. Half your plate is green veggies (spinach, broccoli). One quarter is lean protein. The last quarter is complex carbs. If you stick to this visual guide, you naturally limit the glucose spike.
2. Movement as Medicine
You don’t need to run marathons. In fact, high-intensity cardio can sometimes spike cortisol (and blood sugar) in older adults. The secret weapon? Walking after meals. Just a 15-minute walk immediately after eating can reduce your post-meal blood sugar spike by up to 20%. It engages the muscles to soak up that glucose without needing insulin.
3. Weight Management
Carrying extra weight around the midsection increases insulin resistance. Tracking your metrics is vital here. While BMI isn’t perfect, understanding the benefits of a BMI calculator can give you a baseline to track your overall health trajectory alongside your glucose logs.
💡 Pro Tip: Hydration Matters
When your blood sugar is high, your kidneys try to flush out the excess sugar through urine. This dehydrates you. Paradoxically, being dehydrated concentrates your blood sugar, making the numbers look even higher. Drink a glass of water before you test if you feel dehydrated.
Conclusion: Your Health is in Your Hands
Navigating the blood sugar level chart by age 50 doesn’t have to be a confusing ordeal. It requires a shift in mindset—from “fixing” a problem to managing a dynamic system. By understanding your targets, respecting the risks of hypoglycemia, and using tools like CGMs and smart calculators, you can live a vibrant, energetic life well into your 80s and 90s.
Don’t let the numbers scare you. Let them guide you. Start today by checking your fasting glucose, comparing it to the chart above, and having an honest conversation with your doctor about where you fit in.
For more information on preventing complications, the Centers for Disease Control and Prevention (CDC) provides excellent guides on daily management.
❓ Frequently Asked Questions
What is a dangerous blood sugar level for a 50-year-old?
Generally, a reading below 70 mg/dL is considered hypoglycemia and requires immediate sugar intake. On the high end, consistent readings above 250 mg/dL can lead to ketoacidosis (in Type 1) or hyperosmolar syndrome (in Type 2), both of which are medical emergencies. If you see these numbers, contact your healthcare provider.
Does menopause affect blood sugar levels?
Yes, significantly. The drop in estrogen and progesterone can decrease insulin sensitivity, leading to higher blood sugar levels. Additionally, menopausal sleep disturbances can increase cortisol, further elevating glucose. It’s common to need medication adjustments during this transition.
How often should I check my A1C after age 50?
If your blood sugar is stable and within range, twice a year is standard. However, if you have changed medications or your numbers are fluctuating, your doctor will likely want to check it every 3 months (quarterly).
Can I reverse high blood sugar after 50?
While “reverse” is a strong word, many people can put Type 2 diabetes into remission or return pre-diabetic numbers to normal ranges through significant lifestyle changes, weight loss, and dietary adjustments. It is absolutely possible to regain control.

