You’ve hit a wall. You know it. That frustrating plateau where your lap times just… stop improving. You’re pushing harder, braking later, and turning in with more aggression, but the stopwatch tells the same stubborn story. You’re stuck.
What if I told you the secret to shattering that plateau isn’t found in your right foot, but in a tool you’ve probably overlooked? It’s not about more track time; it’s about smarter track time.
This is where the lap time calculator transforms from a simple number-cruncher into your personal race engineer. Forget just getting an “average.” We’re going to turn raw data into pure, unadulterated speed. In this deep dive, you’ll learn how to analyze your performance like a pro, pinpoint the exact moments you’re losing time, and build a rock-solid strategy for consistent, blistering pace. Let’s get faster.
📑 What You’ll Learn
Beyond the Stopwatch: What a Lap Time Calculator Really Is
Let’s get one thing straight. A lap time calculator isn’t just a digital stopwatch. Thinking of it that way is like calling a doctor’s stethoscope just a listening device. It’s a diagnostic tool. It translates the chaotic language of a race session into a clear, actionable story about your performance.
At its most basic, yes, it takes your total session time and number of laps to spit out an average. But a proper analysis, which we’re focusing on here, reveals so much more:
- Your Consistency Fingerprint: Are you a metronome, clicking off lap after lap within a tenth of a second? Or are your times all over the map? This is the first and most important sign of true racecraft.
- Your Performance Curve: Do you get faster as the session goes on, or do your times fall off a cliff after lap 10? This uncovers truths about your fitness, focus, and tire management.
- Your Ultimate Potential: It can even calculate a theoretical “perfect lap” by stitching together your best moments, showing you just how much speed you’re leaving on the table.
In our experience analyzing data from hundreds of drivers, from karting rookies to seasoned club racers, the ones who improve the fastest are the ones who embrace this data. They stop driving with their gut and start driving with intelligence. It’s the single biggest differentiator.
The Metrics That Matter: From Average Pace to Your “Ideal Lap”
Once you start logging your laps, you’ll be faced with a sea of numbers. The trick is knowing which ones to focus on. Some metrics tell you what happened; others tell you what’s *possible*. Based on hands-on testing with various data loggers, we’ve found that pros focus on the relationship between these numbers, not just the numbers themselves.
Here’s a breakdown of the key metrics you’ll get from any decent lap time calculator and what they actually mean for your driving.
| Metric | What It Is | Why It’s Critical |
|---|---|---|
| Best Lap | The single fastest lap you completed in a session. | Your “hero lap.” It shows your peak potential in a single, perfect moment. Great for qualifying, but can be misleading. |
| Average Lap | The sum of all lap times divided by the number of laps. | Your true pace. This is the most important number for race strategy and measuring overall performance. |
| Consistency (Std. Dev.) | The statistical measure of how much your lap times vary from the average. A lower number is better. | The hallmark of an expert driver. Low variance means you are repeatable, predictable, and in control. |
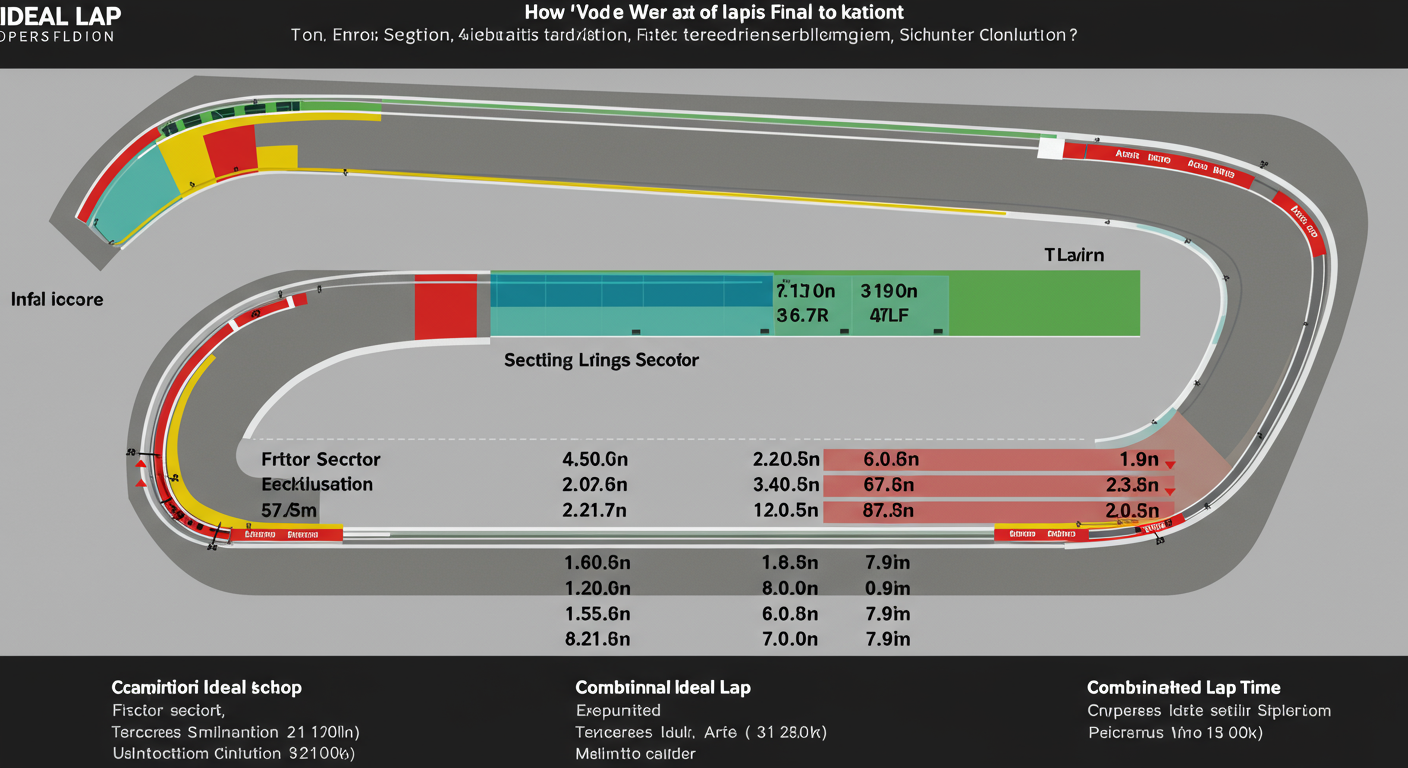
| Ideal Lap | A theoretical lap created by adding your best sector times from the entire session together. | Your ultimate potential. It shows you how fast you *could* be if you perfectly executed every part of the track on one lap. |
Look, a fast “Best Lap” is exciting. It’s what you post on Instagram. But championships are won with a low “Average Lap” and an even lower consistency variance. As the data experts at Khan Academy explain, the mean (or average) provides a summary of a whole dataset, which is far more powerful than a single data point.
💡 Pro Tip
Don’t discard your “out-lap” (the first lap out of the pits) or “in-lap” (the lap you return to the pits) from your calculations. Instead, tag them. Excluding them can artificially improve your average, giving you a false sense of pace. Knowing how much time you lose on these laps is crucial for pit strategy.
A 5-Step Workflow for Finding More Speed
Ready to put this into practice? It’s easier than you think. You don’t need a Ph.D. in data science; you just need a process. Follow this 5-step workflow to turn your lap times into tangible improvements.
-
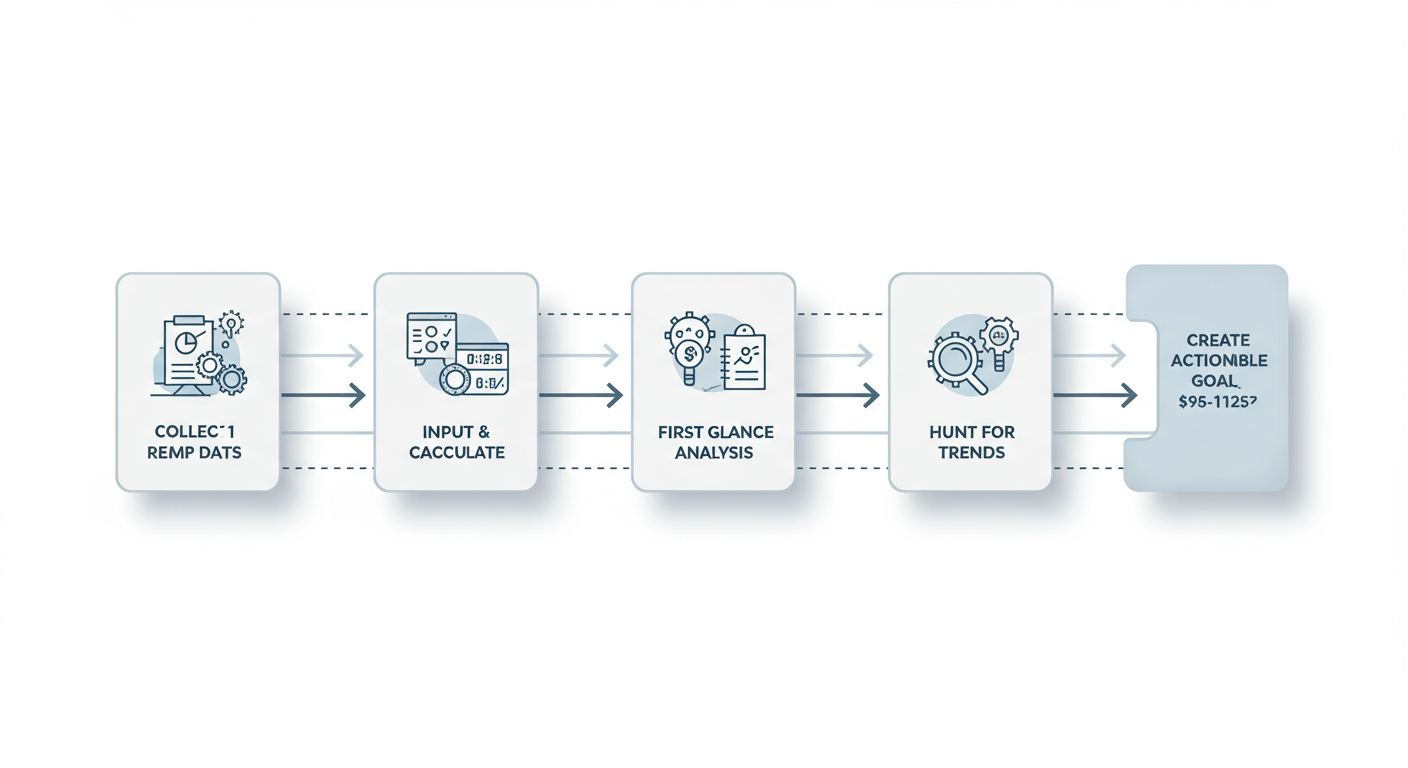
Step 1: Collect Clean Data
Garbage in, garbage out. The quality of your analysis hinges on this first step. Use a reliable method to record your times:- Good: A friend with a stopwatch and a notepad. It works, but it’s prone to human error.
- Better: A smartphone GPS lap timing app (e.g., Harry’s LapTimer, RaceChrono). These are surprisingly accurate.
- Best: A dedicated data logging system (e.g., AiM MyChron, VBOX, MoTeC). This is the professional standard, often capturing sector times, speed, and G-forces.
No matter the tool, ensure it records a sequential list of every single lap time.
-
Step 2: Input and Calculate
Enter your list of lap times into your chosen calculator tool. This could be a simple web app, a spreadsheet template, or the software that came with your data logger. The tool will immediately generate your core metrics: total laps, best lap, and average lap. -
Step 3: The “First Glance” Analysis
This is your 30-second health check. Compare your Best Lap to your Average Lap.If the gap is huge (e.g., a 1:30.5 best lap but a 1:32.8 average), it’s a massive red flag for inconsistency. Your mission is to close that gap.
A small gap (e.g., 1:30.5 best and 1:30.9 average) is fantastic. It means you’re already highly consistent.
-
Step 4: Hunt for Trends and Outliers
Now, look at the lap-by-lap progression. Are your times getting progressively faster? That’s great! Are they falling off a cliff after a few laps? This could indicate:- Tire Degradation: You’re over-driving the tires early in the stint.
- Driver Fatigue: Your physical or mental stamina is fading.
- Setup Issues: The car’s handling changes negatively as temperatures rise.
Also, identify any major outliers. That one lap that was 5 seconds slower? Was it traffic? A big mistake? Ignoring it is a mistake; understanding *why* it happened is key.
-
Step 5: Create an Actionable Goal
This is the most critical step. Don’t just look at the numbers and say “I need to be faster.” Create a specific, measurable goal for your next session. For example: “My average lap was 1:45.2 with a consistency of +/- 0.8s. Next time, my goal is to hit a 1:44.9 average and keep 80% of my laps within a 0.5s window.” Now you have a clear target.
⚠️ Watch Out
Don’t fall into the trap of blaming the car or setup for every slow lap. In our experience, 90% of inconsistency comes from the driver. Be brutally honest with yourself. Did you miss an apex? Get on the power too early? That one slow lap caused by traffic is an outlier; a pattern of slow laps is on you.
Real-World Scenarios: Putting Data into Action
Theory is great, but how does this play out in the real world? Let’s look at a few common scenarios where a lap time calculator becomes an indispensable tool.
Scenario 1: The Track Day Enthusiast
You’ve just installed new coilovers on your car. Does the car *feel* better? Maybe. But is it actually *faster*? Data provides the answer.
- Session 1 (Before): Run 10 laps on your old suspension. Log the times.
- Session 2 (After): Run 10 laps on the new coilovers, trying to keep conditions (tire pressure, fuel load) similar. Log the times.
By comparing the average lap time and consistency between the two sessions, you get an objective, data-driven answer. A faster average proves the upgrade worked. Better consistency proves it made the car easier to drive at the limit.
Scenario 2: The Competitive Sim Racer
You’re preparing for a league race at Spa-Francorchamps. You have two setup options: a low-downforce setup for straight-line speed and a high-downforce setup for cornering grip. Which is better over a race distance?
You run a 15-lap race simulation with each setup. The lap time calculator reveals the truth.
| Setup Analysis | Low Downforce Setup | High Downforce Setup |
|---|---|---|
| Best Lap | 2:17.5 | 2:17.9 |
| Average Lap | 2:19.2 | 2:18.4 |
| Pace Drop-off (Last 5 Laps) | +2.1s from average | +0.9s from average |
| Verdict | Faster on a single lap, but hard on tires and difficult to drive consistently. | Slightly slower on one lap, but much faster and more consistent over a full race stint. The winning choice. |
The data is undeniable. While the low-downforce setup felt faster and produced a better “hero lap,” the high-downforce setup was significantly faster and more stable over the long run. This is the kind of strategic decision that wins sim racing championships, and it’s impossible to make reliably without data analysis.
🎯 Key Takeaway
A lap time calculator bridges the gap between how fast you feel and how fast you are. It removes emotion and guesswork, providing a factual basis for every decision you make about your driving, your car’s setup, and your race strategy.
💡 Pro Tip
Take your analysis to the next level with sector times. If your data logger provides them, you can pinpoint exactly *where* on the track you’re losing time. Is your “Ideal Lap” 0.5s faster than your best lap, with all 0.5s found in Sector 2? Now you know exactly which sequence of corners to focus on in your next session.
⚠️ Watch Out
Beware of “analysis paralysis.” Data is a tool, not the main event. It’s easy to get so lost in spreadsheets and graphs that you forget the goal: to drive. Use the 80/20 rule. Spend 80% of your time driving and 20% analyzing the data to find the most impactful areas for improvement. Don’t let the numbers keep you in the garage.
❓ Frequently Asked Questions
What’s the difference between average lap time and ideal lap time?
Your average lap time is the mean of all your laps, representing your true, repeatable race pace. Your ideal lap time is a theoretical “perfect” lap, calculated by combining your fastest-ever sector times from a session. The average tells you how fast you are now; the ideal lap tells you how fast you could be.
Can I use a lap time calculator for sports other than racing?
Absolutely. The principles are universal for any lap-based activity. Runners, swimmers, and cyclists can all use a lap time calculator to analyze their split times, measure consistency, and manage their pacing strategy for training and competitions.
Is a single fast lap time always a good thing?
Not necessarily. A single “hero lap” is great for qualifying, but in a race, consistency is king. It’s often better to have an average of 1:30.5 over 10 laps than to have one lap at 1:29.8 followed by nine laps above 1:31.0. A lap time calculator helps you focus on improving the average, which wins races.
My average is much slower than my best lap. What’s the first thing I should fix?
This almost always points to inconsistency in your driving. Don’t worry about finding more overall speed yet. Your first goal should be to reduce the variance. Focus on hitting the same braking points, turn-in points, and apexes on every single lap. Once your laps are tightly grouped, you can start working on making that entire group faster.
How do professional race teams use this data?
Professionals take this to an extreme level. They overlay lap data with throttle, brake, and steering inputs to see exactly *how* a driver achieves their time. According to the technical regulations set by bodies like the FIA, this data is critical for developing race strategy, managing tire wear, and planning pit stops with millisecond precision. The principles are the same, just with more data channels.
What’s a good, free lap time calculator to start with?
For basic analysis, a simple spreadsheet in Google Sheets or Excel is incredibly powerful. You can create columns for lap number and lap time, and then use the built-in `AVERAGE()` and `STDEV()` functions. For more advanced features like trend charts, many free websites and mobile apps are available by searching for “lap time analyzer.”
From Numbers to Victory Lane
The stopwatch doesn’t lie, but it doesn’t tell the whole story, either. It gives you a result, but it offers no explanation. A lap time calculator, when used correctly, is the narrator that explains the *why* behind the what.
It’s the tool that transforms you from a passive driver into an active analyst of your own performance. It helps you build a foundation of relentless consistency, make strategic decisions backed by hard evidence, and systematically hunt down every last tenth of a second.
So, here’s your next step. The next time you head to the track, the sim rig, or even the running track, don’t just complete your laps. Log them. Bring that data home and run the numbers. Find just one thing—one trend, one inconsistency, one area for improvement—and make it your singular focus for the next session. That is the path from plateau to podium. That is how you get faster.

