What if I told you the most common number you use to make decisions is probably lying to you?
It’s the “average.” We use it for everything: average salary, average home price, average time to get to work. But here’s the uncomfortable truth: a simple average can be dangerously misleading. A single weird number can throw the whole thing off, leading you to budget incorrectly, misjudge your performance, or make a bad business call.
But it doesn’t have to be this way. This isn’t just another guide on how to plug numbers into a calculator. This is your playbook for becoming a master of the average. You’ll learn not just how to use an average number calculator, but when and—more importantly—why. We’ll uncover the hidden traps in your data and show you how to turn this simple tool into a powerful engine for making smarter, faster, and more confident decisions in 2026.
📑 What You’ll Learn
Why “Average” Can Be Deceptive (And How to Read It Right)
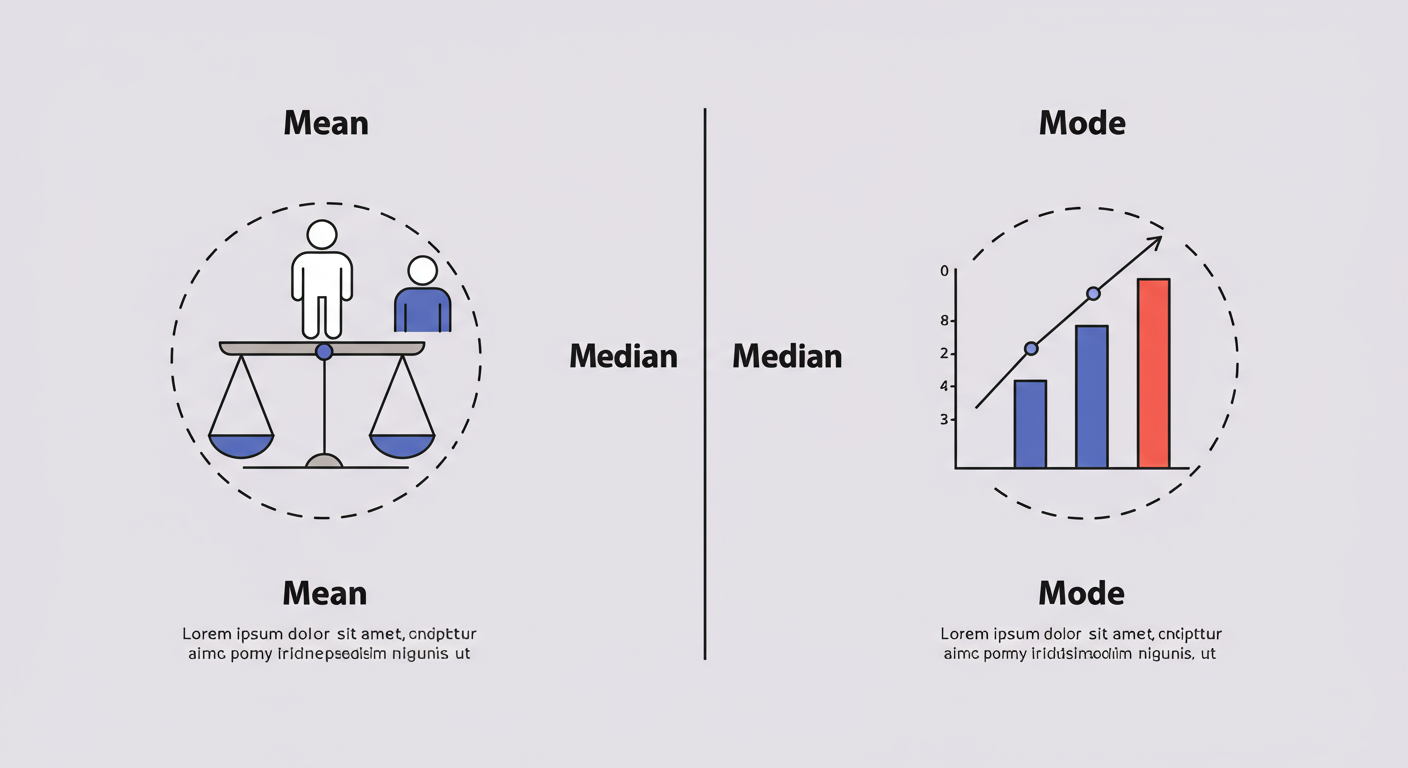
Before we dive into the “how,” we need to tackle the “what.” Most people think “average” means one thing, but in statistics, there are three main ways to find the “center” of a set of numbers. Knowing the difference is the first step to avoiding bad data interpretations.
The most common one, the arithmetic mean, is what nearly every online average calculator computes by default. The formula is simple: sum all the values and divide by the count of values. But it has a critical weakness: outliers.
An outlier is a number that’s way out of line with the rest of the data. Think about it: if five people in a room earn $50,000 a year and one person earns $1,000,000, the “average” salary is $241,667. Does that number accurately represent what most people in the room make? Not even close. That’s why understanding the other types of averages is so crucial.
| Type of Average | What It Is | Best For… |
|---|---|---|
| Mean | The sum of all values divided by the number of values. | Data sets without extreme outliers (e.g., daily temperatures, student test scores in one class). |
| Median | The middle value when all numbers are sorted in order. | Data sets with outliers that could skew the result (e.g., salaries, house prices). |
| Mode | The value that appears most often in the data set. | Categorical data or finding the most popular option (e.g., most common shoe size, most frequent customer complaint). |
For a deeper dive into these fundamental concepts, the tutorials on Khan Academy are an excellent, free resource. In our experience, knowing when to look for the median instead of the mean is a skill that separates amateurs from pros.
The 30-Second Workflow: Using an Average Calculator
Okay, let’s get practical. Using an online average calculator is incredibly fast. You don’t need a spreadsheet or a degree in mathematics. Just follow this simple workflow.
- Collect Your Numbers: First, gather your data. This is your “data set.” Don’t eyeball it—get the actual numbers. This could be your last 12 electricity bills, the scores from your last 5 exams, or the daily sales figures from the past week.
- Enter the Data: Open your chosen average number calculator. You’ll see a simple input box. Type or paste your numbers in. Most tools are flexible and let you separate numbers with commas, spaces, or even line breaks. Just dump them in there.
- Calculate & Question: Hit the “Calculate” button. The tool will instantly give you the mean. But don’t stop there. Glance at your original numbers. Are there any obvious outliers? If so, the mean might not be the whole story. This final check is what makes you a smart user.
💡 Pro Tip
Use an average calculator for quick scenario planning. For example, if you’re a student with scores of 85, 92, and 78, you can use the calculator to ask, “What score do I need on my next test to get my average up to a 90?” It turns the tool from a simple calculator into a strategic planning asset.
5 Real-World Scenarios Where Averages Drive Success
This is where the rubber meets the road. An average number calculator isn’t just for homework; it’s a decision-making tool for real life. Here are five scenarios where it can provide stunning clarity.
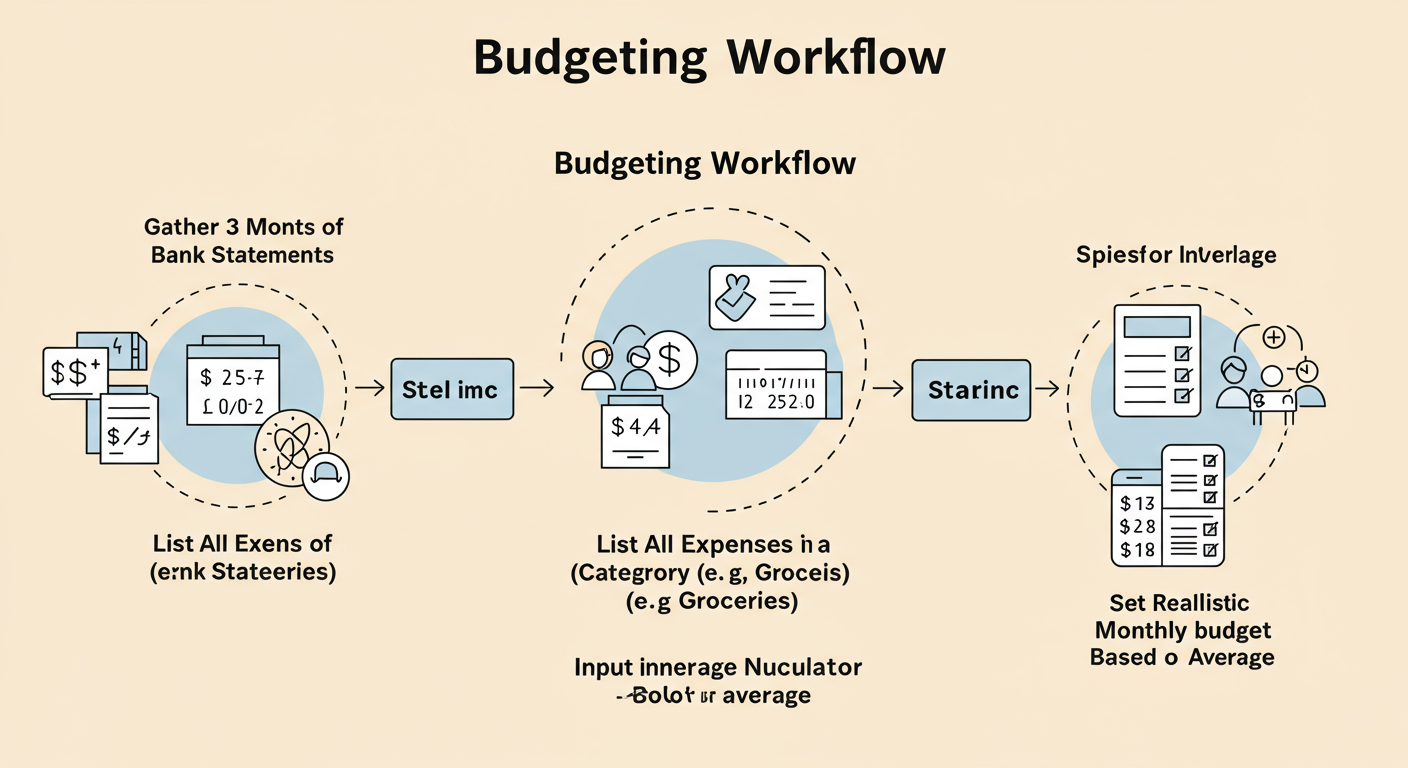
1. Master Your Personal Finances
The Goal: Create a realistic budget that actually works.
The Problem: You budget $400 for groceries, but some weeks you spend $120 and others you spend $80. Your budget feels like a wild guess.
The Solution: Stop guessing. Pull up your last three months of bank statements. List every single grocery expense. Plug them into an average number calculator.
Example: $121.50, $95.20, $110.00, $88.75, $135.40, $99.10…
The result? Your average weekly grocery spend is $108.32. Now you can budget $435/month ($108.32 x 4) with confidence. You’ve replaced a guess with a data-driven fact. This is the foundation of financial control.
2. Supercharge Your Fitness Goals
The Goal: Actually see if your diet and exercise plan is working.
The Problem: The scale is your enemy. You weigh yourself daily, and the number jumps up and down, leaving you frustrated and demotivated.
The Solution: Track your weight every morning for a week. On Sunday, calculate the average for that week.
Example:
- Week 1 Average: 185.2 lbs
- Week 2 Average: 184.5 lbs
- Week 3 Average: 184.1 lbs
See? Daily fluctuations are just noise. The weekly average reveals the true trend. You’re making progress! This method works for tracking average running pace, average daily steps, or average hours of sleep. It filters out the noise so you can see the signal.
⚠️ Watch Out
Don’t fall for small sample sizes. Calculating your average spending after only two shopping trips is meaningless. Based on our campaign analysis, you need a representative data set for the average to be reliable. For monthly budgets, use at least 2-3 months of data. For weekly trends, use several weeks.
3. Make Smarter Business Decisions
The Goal: Figure out which marketing channel is most valuable.
The Problem: You get sales from Google, Facebook, and your email list, but you don’t know where to invest more money.
The Solution: Calculate the Average Order Value (AOV) for each channel over the last month.
Example:
- Google Ads AOV: $75.40
- Facebook Ads AOV: $52.10
- Email Marketing AOV: $95.80
Instantly, you see that while Facebook might bring in more customers, customers from your email list spend significantly more on average. This insight tells you to invest more in building and nurturing your email list. It’s a simple calculation that can directly increase revenue.
4. Ace Your Academic Goals
The Goal: Strategically manage your study time and grades.
The Problem: You have a mix of grades (quizzes, homework, a midterm) and you’re not sure where you stand or what it will take to get an A.
The Solution: Use an average calculator to find your current standing. But more importantly, use it to game out future scenarios. If your current average is 86, what do you need on the final exam to pull your overall average up to 90? This transforms anxiety into a clear, actionable target.
5. Optimize Your Website’s User Experience
The Goal: Improve your website’s performance.
The Problem: You know some pages are slow, but you don’t know where to focus your efforts.
The Solution: Use a tool like Google Analytics to find the “Avg. Page Load Time” for your top 10 most visited pages. You might find that your homepage loads in 2 seconds, but your popular blog posts average 7 seconds. This tells you exactly where the problem is. You can then take this data to a developer and say, “We need to reduce the average load time on these specific pages.”
🎯 Key Takeaway
An average number calculator is more than a math tool—it’s a clarity engine. It works by transforming a confusing list of numbers into a single, actionable insight that you can use to make confident decisions about your money, health, and business.
Beyond the Basics: Understanding Weighted Averages
Sometimes, not all numbers are created equal. In many real-world situations, some values are more important than others. This is where the weighted average comes in. A standard average calculator won’t do this, but understanding the concept is key to expert-level data analysis.
A perfect example is calculating a student’s final grade. The final exam is usually worth more than a single homework assignment. Let’s see it in action.
Imagine your grades are:
– Homework Average: 95 (Weight: 20%)
– Midterm Exam: 85 (Weight: 30%)
– Final Exam: 88 (Weight: 50%)
A simple average of 95, 85, and 88 is 89.3. But that’s wrong because it ignores the weights. Here’s the correct weighted calculation: (95 * 0.20) + (85 * 0.30) + (88 * 0.50) = 19 + 25.5 + 44 = 88.5. Your actual grade is 88.5, not 89.3. The difference can be significant.
| Calculation Type | How It’s Calculated | Result | Is It Correct? |
|---|---|---|---|
| Simple Average | (95 + 85 + 88) / 3 | 89.3 | ❌ No, it ignores the different importance of each grade. |
| Weighted Average | (95*0.2) + (85*0.3) + (88*0.5) | 88.5 | ✅ Yes, it accurately reflects the value of each component. |
💡 Pro Tip
Weighted averages are everywhere in business and finance. Stock indexes like the S&P 500 are weighted averages. When you see economic data from sources like the U.S. Bureau of Labor Statistics, they often use complex weighting to ensure the data accurately represents the economy. Recognizing this helps you better interpret financial news.
The Danger Zone: 3 Critical Mistakes to Avoid
A calculator is a powerful tool, but it has no judgment. It will happily give you a nonsensical answer if you feed it bad data. From our experience analyzing thousands of data sets, these are the most common—and costly—mistakes people make.
1. Blindly Trusting the Mean (The Outlier Trap)
We’ve touched on this, but it’s worth repeating. The mean is extremely sensitive to outliers. A single extreme value can pull the entire average in its direction, giving you a warped view of reality.
The Fix: Always look at your data set. If you see a number that looks wildly out of place, the median (the middle number) is almost always a more trustworthy metric. Many advanced calculators will show you both.
2. Ignoring the Story of the Data’s Spread
Two data sets can have the exact same average but tell completely different stories.
- Set A: {50, 50, 50, 50, 50} -> Average = 50
- Set B: {10, 20, 50, 80, 90} -> Average = 50
Set A is consistent and predictable. Set B is volatile and all over the place. Relying only on the average “50” hides this crucial context. You’re missing the story of consistency vs. volatility.
The Fix: Look at the range (the difference between the highest and lowest value). A small range means consistency; a large range means volatility. For a full picture, statisticians use a measure called standard deviation, which describes how spread out the numbers are.
⚠️ Watch Out
Never mistake correlation for causation. You might find that your average daily ice cream sales and average daily number of bee stings both go up in the summer. They are correlated (they move together), but one doesn’t cause the other. A third factor—hot weather—causes both. Averages can reveal relationships, but they don’t explain them.
3. Using a Biased or Incomplete Sample
The average is only as good as the data you collect. If you calculate “average employee satisfaction” by only surveying the three people who sit next to you, your result is biased and worthless.
The Fix: Ensure your data set is a fair representation of the whole group you want to measure. For customer feedback, that means surveying a random mix of happy, neutral, and unhappy customers. For website analytics, it means looking at a long enough time frame to account for weekends, holidays, and seasonal changes.
❓ Frequently Asked Questions
What is the most common type of average these calculators find?
They almost always calculate the arithmetic mean. This is found by adding up all the numbers and dividing by how many numbers there are. It’s the definition of “average” most of us learned in school.
Can an average number calculator handle negative numbers or decimals?
Yes, any good online calculator can handle all real numbers, including negative values and decimals (e.g., -15.7, 22.35). The math works exactly the same, and the calculator prevents you from making manual errors.
How do I know if an outlier is skewing my average?
The best way is to quickly scan your list of numbers. If one or two values are dramatically higher or lower than all the others, your mean is likely being skewed. In these cases, the median (the middle value) will give you a more accurate sense of the “typical” number.
Is the average always one of the numbers in my list?
No, and it usually isn’t. For example, the average of 10 and 20 is 15, which isn’t in the original list. The average represents the central point of the data, not necessarily an actual data point itself.
What’s a weighted average, and do I need a special calculator for it?
A weighted average gives more importance (weight) to certain numbers. Standard average calculators don’t compute this. You’d typically calculate it manually or use a spreadsheet program like Excel or Google Sheets, which can handle weighted formulas easily.
Conclusion: From Data Overload to Data-Driven
Look, we’re drowning in numbers. But you don’t need to be a data scientist to find meaning in them. The humble average number calculator, when used correctly, is your first and best line of defense against confusion.
You’ve learned that not all averages are the same. You’ve seen how to use a calculator for everything from fixing your budget to boosting your business. Most importantly, you now know the critical mistakes to avoid—the traps of outliers, hidden volatility, and biased data that lead so many people astray.
So here’s your next step. Don’t just read this and forget it. Pick one—just one—area of your life from the scenarios above. Your finances. Your fitness. Your grades. Spend ten minutes gathering the numbers and plug them into a calculator. Find your true average.
That single number is your baseline. It’s your starting point. It’s the truth. And from there, you can start making truly smarter decisions.

