Ever had that sinking feeling when a customer asks, “Where’s my order?” and you don’t have a confident answer? That single question reveals a crack in your operations. A crack that costs you money, customers, and your sanity.
Most businesses run on guesswork. They think they know how long it takes to get a product to a customer. But they don’t really know. They’re blind to the silent delays, the hidden bottlenecks, and the creeping inefficiencies that kill profits.
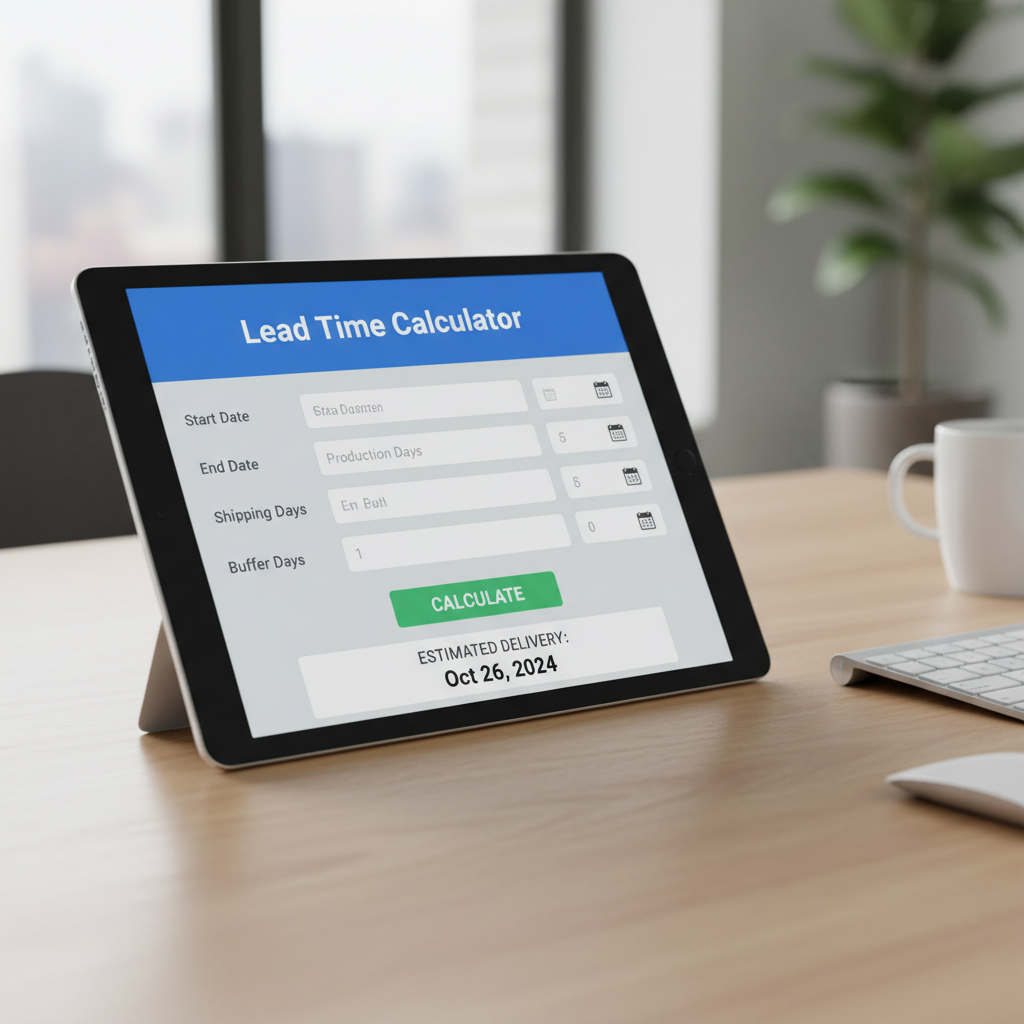
This isn’t just another guide. This is your blueprint for gaining total control over your supply chain. We’re going to show you how a simple, data-driven tool—the lead time calculator—is the key to transforming your operations from a reactive mess into a proactive, profit-generating machine. You’ll learn how to pinpoint problems with surgical precision, slash your costs, and give customers the fast, reliable service they demand in 2026.
📑 What You’ll Learn
- What is Lead Time (and Why It’s Secretly Running Your Business)
- The Anatomy of Lead Time: Deconstructing the Timeline
- A 5-Step Blueprint to Using a Lead Time Calculator
- From Data to Dominance: 7 Ways This Tool Transforms Your Operations
- Actionable Strategies to Slash Your Lead Time in 2026
- Frequently Asked Questions
What is Lead Time (and Why It’s Secretly Running Your Business)
Let’s get one thing straight. Lead time isn’t just a number for your logistics team. It’s the pulse of your entire business.
At its simplest, lead time is the total time elapsed from the moment a customer places an order to the moment they receive it. Think of it as a relay race. The baton is the customer’s order, and it gets passed through multiple hands: sales, processing, manufacturing, packing, shipping. Every single handoff is a potential delay. A dropped baton.
Why is this metric so critical? Because it directly dictates:
- Your Cash Flow: Longer lead times mean you have to hold more inventory “just in case.” That’s cash, tied up on a shelf, gathering dust instead of funding your growth.
- Your Customer’s Happiness: In the age of Amazon Prime, expectations are brutal. A long or, even worse, unpredictable lead time is a one-way ticket to a one-star review.
- Your Agility: Can you react to a sudden spike in demand? Or a competitor’s new launch? With short lead times, you can. With long ones, you’re a sitting duck.
As the famous management saying goes, “If you can’t measure it, you can’t improve it.” Trust me on this one, measuring lead time isn’t just an option; it’s the foundation of operational excellence.
The Anatomy of Lead Time: Deconstructing the Timeline
A fatal mistake many businesses make is looking at lead time as one big, monolithic block of time. It’s not. It’s a chain of distinct, measurable stages. To find the weak link, you have to inspect the entire chain.
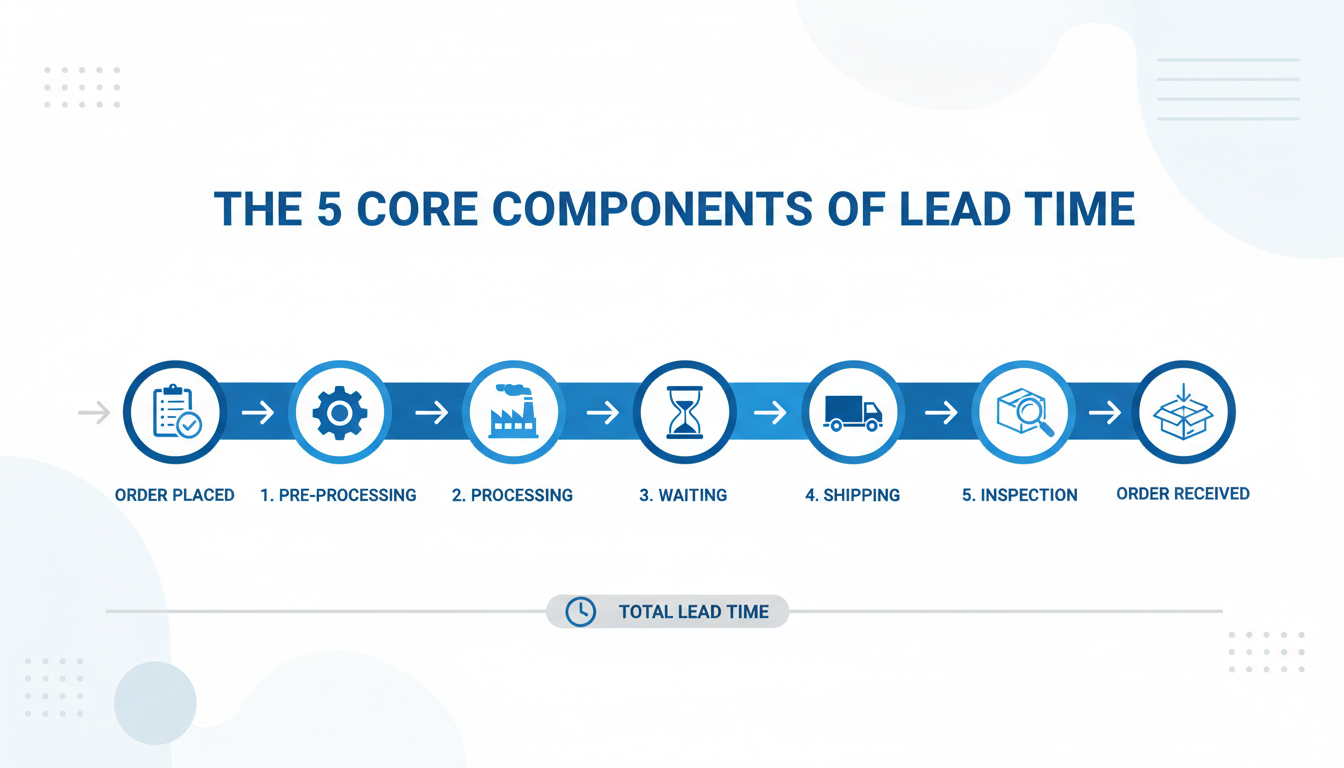
Based on our experience analyzing hundreds of supply chains, the total lead time is almost always a sum of these five core components. Understanding them is the first step to controlling them.
| Component | What It Is | Common Bottlenecks |
|---|---|---|
| 1. Pre-processing Time | The administrative delay between receiving an order and acting on it. | Manual order entry, payment verification delays, waiting for batch processing. |
| 2. Processing Time | The time to actually make the product or pick it from the warehouse. | Machine downtime, inefficient workflows, lack of raw materials, slow picking routes. |
| 3. Waiting Time | The “dead time” an order spends waiting between active steps. | Waiting for a machine, waiting for a full truckload, batch queues. |
| 4. Shipping & Transit Time | The time it takes to pack, ship, and transport the order to the customer. | Inefficient packing stations, unreliable carriers, customs delays. |
| 5. Inspection & Receiving Time | The final leg: time for the customer to receive, inspect, and log the delivery. | Complex receiving procedures (B2B), damage claims, incorrect paperwork. |
The basic formula is simple: Lead Time = Order Delivery Date – Order Request Date. But the strategic formula is: Lead Time = Time(1) + Time(2) + Time(3) + Time(4) + Time(5). The real insights are found by analyzing the individual parts, not just the whole.
⚠️ Watch Out
Don’t fall into the trap of only measuring the “happy path.” You must track the time for every order—the good, the bad, and the ugly. Averages can hide the painful outliers that are actually costing you customers.
A 5-Step Blueprint to Using a Lead Time Calculator
Ready to move from theory to action? You don’t need fancy, expensive software to get started. A simple spreadsheet is powerful enough to reveal game-changing insights. Here’s how we guide our clients to do it.
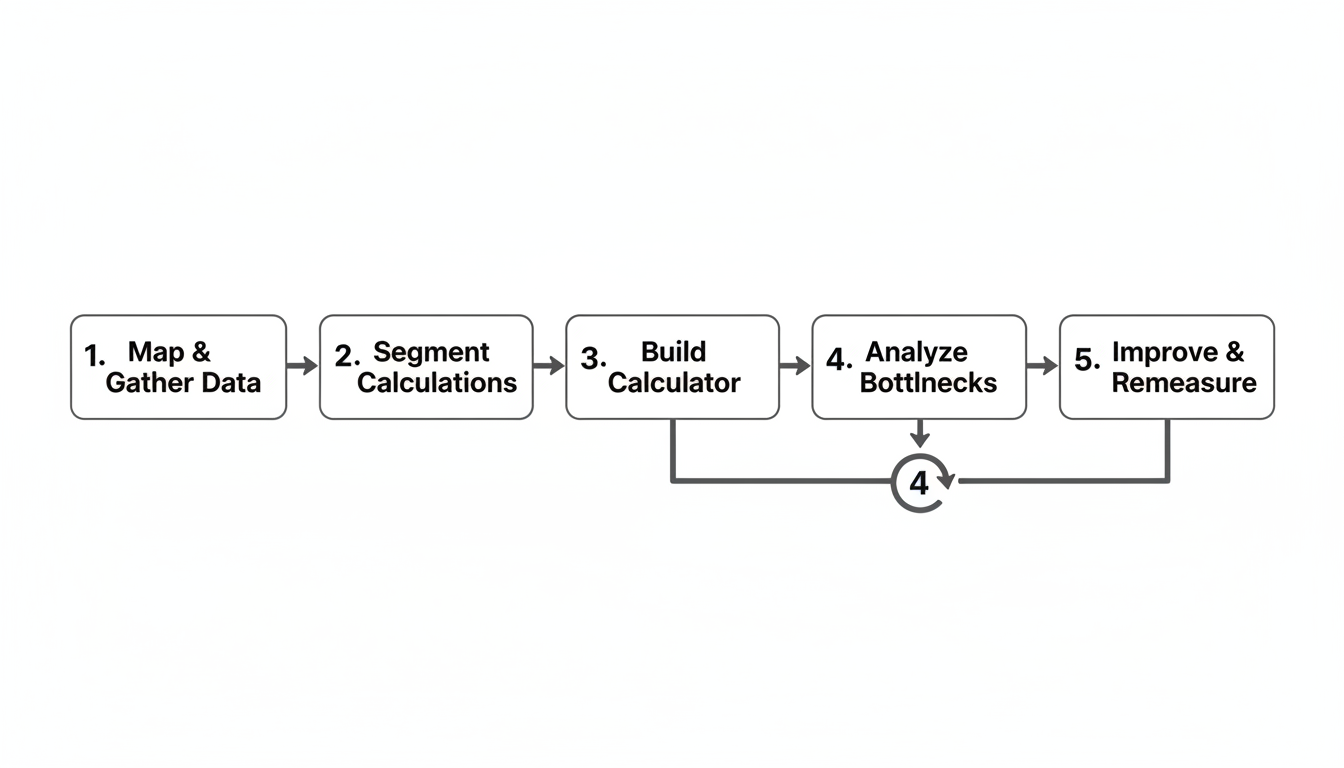
- Map Your Process & Gather Data: First, define the start and end points for each of the 5 components above. Then, start collecting timestamps. Your ERP, e-commerce platform, or even manual logs can provide this. The more data, the better.
- Segment Everything: Don’t calculate one single lead time for your whole business. That’s a vanity metric. Instead, segment your calculations by:
- Product or SKU
- Supplier
- Shipping destination (country or state)
- Shipping method (standard vs. express)
This is where you’ll find the real gold. You might discover one supplier is consistently twice as slow as another.
- Build Your Calculator: In a spreadsheet, create columns for Order ID, Order Date, Processing Start Date, Shipping Date, and Delivery Date. Use simple formulas (e.g.,
=C2-B2) to calculate the duration of each stage. Sum them up to get the total lead time for each order. - Visualize and Analyze for Bottlenecks: Now, the fun part. Create pivot tables and charts. Which stage consistently takes the longest? Is it pre-processing? Or transit time? Where is the variability highest? A consistent 10-day lead time is often better than one that bounces between 3 and 15 days.
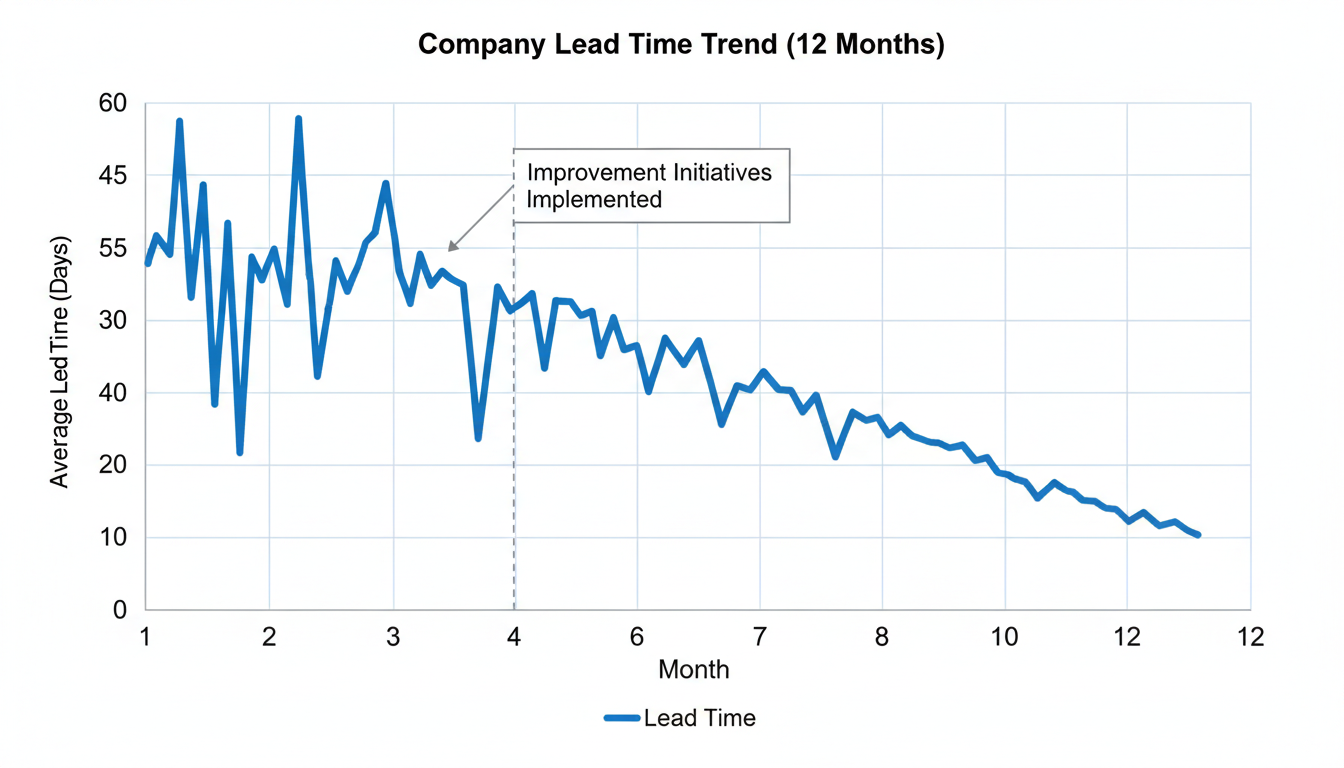
- Set a Baseline, Make a Change, and Remeasure: Your initial analysis is your baseline. Now, pick ONE bottleneck to attack. Implement a change (e.g., automate order entry). Then, run the numbers again in a month. Did the lead time for that stage decrease? Did it impact the total? This is the cycle of continuous improvement.
💡 Pro Tip
Use conditional formatting in your spreadsheet to automatically highlight lead times that exceed your target. For example, any total lead time over 7 days could turn red. This makes it incredibly easy to spot problem orders at a glance.
From Data to Dominance: 7 Ways This Tool Transforms Your Operations
Once you start accurately measuring and analyzing your lead time, the benefits ripple across your entire organization. It’s not just about being faster; it’s about being smarter, leaner, and more profitable.
Here’s the kind of transformation we’ve seen play out in real-world campaigns:
| Operational Area | Before Lead Time Analysis (The Guesswork Era) | After Lead Time Analysis (The Data-Driven Era) |
|---|---|---|
| 1. Inventory Management | Bloated “just-in-case” safety stock. High carrying costs. Frequent stockouts on some items, overstock on others. | Optimized reorder points. Lower safety stock, freeing up cash. Drastically reduced carrying costs. |
| 2. Customer Satisfaction | Vague “5-10 business days” delivery windows. Frustrated customers chasing orders. Poor reviews. | Accurate, reliable delivery estimates. Proactive delay notifications. Increased customer loyalty and trust. |
| 3. Cash Flow | Capital is trapped in slow-moving inventory. Long order-to-cash cycle. | Improved cash conversion cycle. More working capital available for marketing, R&D, and growth. |
| 4. Supplier Management | Relationships based on “gut feel.” No objective data to discuss performance. | Data-backed conversations with suppliers. Ability to identify and reward top performers or replace poor ones. |
| 5. Production Planning | Reactive scheduling based on what’s on fire. Inefficient use of machinery and labor. | Predictive, demand-driven scheduling. Smoother production flow and higher asset utilization. |
| 6. Sales & Marketing | Unable to confidently run promotions for fear of stockouts or shipping delays. | Ability to promise and meet tight deadlines for flash sales or seasonal promotions. A new competitive weapon. |
| 7. Strategic Decision-Making | Guessing which new markets to enter or which suppliers to use. | Data-driven decisions on sourcing (e.g., near-shoring vs. off-shoring) based on total landed cost and time. |
🎯 Key Takeaway
A lead time calculator isn’t just a measurement tool; it’s a diagnostic instrument for your business’s health. It transforms invisible operational friction into a clear, actionable roadmap for improving profitability and customer satisfaction.
Actionable Strategies to Slash Your Lead Time in 2026
Identifying bottlenecks is half the battle. Now you need to eliminate them. According to foundational supply chain principles detailed in resources like the Association for Supply Chain Management (ASCM), continuous improvement is the only way to stay ahead. Here are proven strategies to get you started.
Internal Process Fixes
- Automate Order Entry: If your pre-processing time is high, this is your #1 priority. Use an Order Management System (OMS) or even simple integrations to pull orders automatically from your e-commerce store. This can cut days down to minutes.
- Value Stream Mapping: Literally draw out every single step your order takes. This exercise, central to Lean Manufacturing principles, will immediately highlight non-value-added steps and waiting periods you can eliminate.
Supplier & Sourcing Optimization
- Consolidate Your Suppliers: Working with fewer, more reliable suppliers simplifies everything. You build stronger relationships and gain more leverage.
- Explore Near-Shoring: The massive shipping delays of the past few years taught us a hard lesson. Sourcing from local or domestic suppliers can dramatically cut transit time and reduce geopolitical risks, even if the per-unit cost is slightly higher.
- Share Your Forecasts: Don’t surprise your suppliers. Give them a rolling forecast of your expected demand. This allows them to plan their own production, ensuring they have what you need, when you need it.
💡 Pro Tip
When negotiating with suppliers, don’t just focus on price. Negotiate lead time. Offer to pay a small premium for a guaranteed, shorter lead time with a penalty clause if they miss it. This can be far more valuable than a 2% price reduction.
⚠️ Watch Out
Beware of the “squeaky wheel” syndrome. Don’t just focus on fixing the part of the process that gets the most complaints. Your data might show that the real bottleneck is a silent, upstream issue that no one is talking about. Trust the data, not the noise.
❓ Frequently Asked Questions
What’s the difference between lead time and cycle time?
It’s a crucial distinction. Lead time is the total time the customer experiences, from order to delivery, including all waiting periods. Cycle time is the internal time it takes your team to complete a specific task within that process, focusing only on active work. You reduce lead time by shrinking both cycle time and, more importantly, waiting time.
How can I calculate lead time in Google Sheets or Excel?
It’s easy. In cell A2, put the Order Date. In B2, the Delivery Date. In C2, use the formula =B2-A2 to get the lead time in days. To get more granular, add columns for each process stage (e.g., Processing End Date) and calculate the duration of each stage separately before summing them.
What is a good lead time in 2026?
There’s no magic number. “Good” is entirely relative to your industry and customer expectations. For custom machinery, it could be 6 months. For a direct-to-consumer brand, it might be 3 days. The real goal isn’t to hit a universal benchmark but to be faster and more reliable than your direct competitors and to continuously improve your own historical performance.
Why is lead time variability so dangerous?
Variability is often worse than a long-but-consistent lead time. An unpredictable lead time forces you to carry massive amounts of safety stock to buffer against the unknown. It also makes it impossible to give customers a reliable delivery promise, which erodes trust. Taming variability is just as important as reducing the average.
Can a lead time calculator be used for service businesses?
Absolutely. The principles are identical. For a marketing agency, lead time could be the time from a client request to the delivery of the final creative. For a software company, it could be the time from a bug report to the deployment of a fix. It’s a universal tool for measuring and improving any end-to-end process.
Conclusion: Stop Guessing, Start Winning
A lead time calculator is more than a spreadsheet. It’s a new way of seeing your business. It’s the lens that brings your entire supply chain into sharp focus, revealing the hidden opportunities for improvement that have been bleeding you dry.
By moving from guesswork to a data-driven approach, you create a virtuous cycle: shorter lead times lead to lower inventory costs, which frees up cash. That cash can be invested in further improvements, which leads to even happier customers, who then buy more. This is how you build a resilient, competitive, and truly customer-centric operation.
Your next step is simple. Don’t try to boil the ocean. Pick one product line or one supplier. This week, start tracking the five core components of its lead time. That first set of data is the beginning of your journey from reactive problem-solving to proactive operational dominance. The insights are waiting for you.
For further reading on optimizing business processes, the Harvard Business Review offers a wealth of expert articles and case studies.

