You’ve hit a wall. You’re pushing the car to its absolute limit, braking later, turning in harder, and yet the stopwatch tells the same frustrating story. You’re stuck. That half-second you’ve been chasing for months feels a million miles away. Sound familiar?
Here’s the brutal truth: “feeling fast” and being fast are two completely different things. The gap between them is filled with data. Raw, unbiased, and powerful data.
This isn’t just another article about a simple tool. This is your new playbook for data-driven dominance. You’re about to learn how a lap time calculator can transform you from a driver who relies on gut feeling into a strategic competitor who knows exactly where to find more speed. We’ll break down how to analyze your performance, pinpoint crippling inconsistencies, and build a race strategy that leaves your rivals guessing.
📑 What You’ll Learn
Beyond the Stopwatch: What a Lap Time Calculator Really Tells You
Let’s get one thing straight. A lap time calculator isn’t just a glorified adding machine. Thinking of it that way is like calling a race engineer a “mechanic.” It’s a diagnostic tool that translates a list of numbers into a clear narrative about your performance.
It answers the questions that truly matter:
- What is my true race pace? Not your one-lap wonder, but the sustainable speed you can hold under pressure.
- Where am I inconsistent? It highlights the gap between your best and worst laps, revealing where you lose focus, make mistakes, or struggle with the car.
- Are my setup changes actually working? The data provides objective proof, ending the “I think it feels better” debate for good.
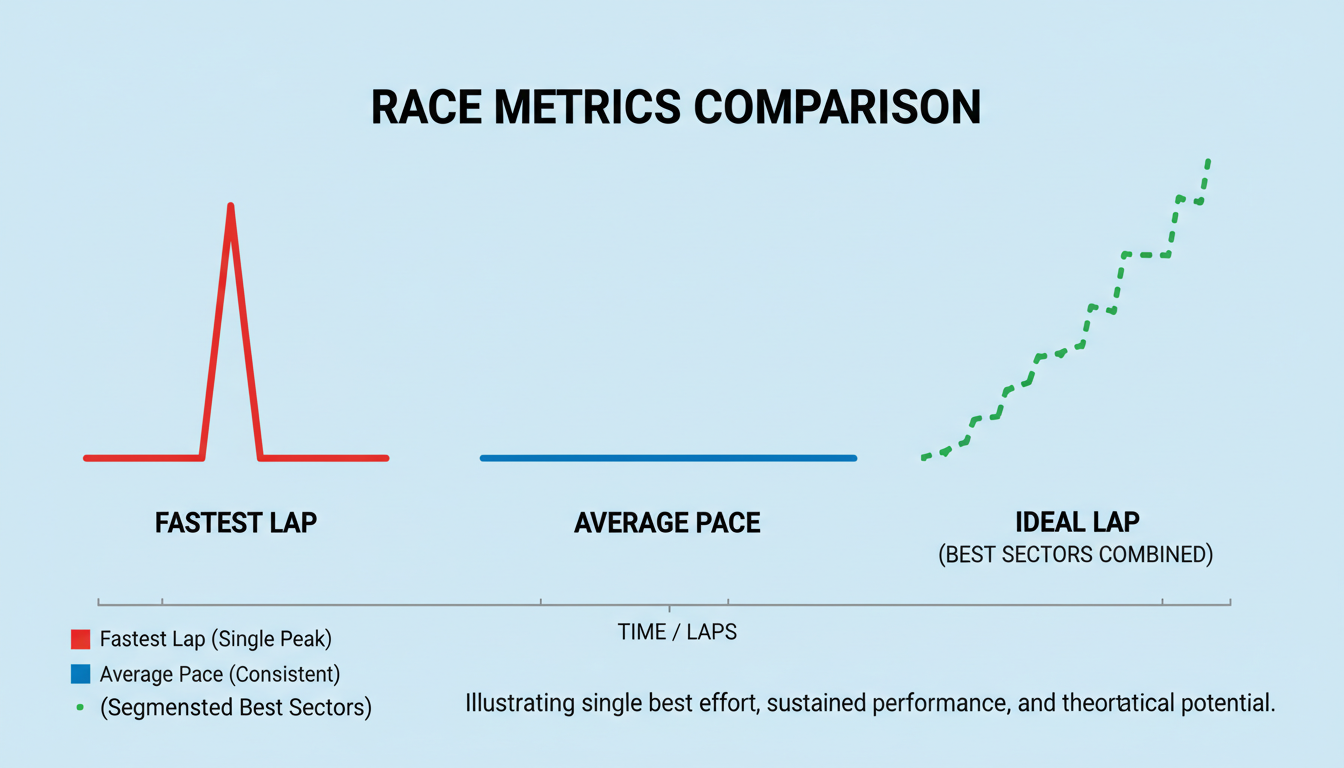
Essentially, it separates your potential pace (your fastest “hero” lap) from your actual pace (your average). The entire goal of performance driving is to shrink the gap between those two numbers. And this tool is your map to get there.
The 3 Core Metrics That Actually Matter
When you plug your times into a calculator, you’ll get a flood of numbers. It’s easy to get overwhelmed. In our experience analyzing thousands of laps from amateurs to pros, performance boils down to understanding just three key metrics. Master these, and you’re ahead of 90% of the competition.
| Metric | What It Is | Why It’s Critical |
|---|---|---|
| Fastest Lap (The “Hero Lap”) | Your single best lap of the session. A flash of brilliance. | Shows your ultimate potential. It’s your qualifying pace and the benchmark for what’s possible. |
| Average Lap Time (The “Race Pace”) | The mean of all your valid laps. Your sustainable speed. | This is the single most important number. It predicts race outcomes, informs strategy, and tracks real progress. Consistency wins championships, not hero laps. |
| Consistency (Standard Deviation) | The measure of how spread out your lap times are from the average. | A low number (e.g., under 0.5s) means you’re a machine. A high number means you’re unpredictable and likely making mistakes. This is where you find the low-hanging fruit for improvement. |
💡 Pro Tip
When calculating your average, always throw out the “outlier” laps. This includes your out-lap (leaving the pits), in-lap (entering the pits), and any lap where you were obviously blocked by traffic or spun out. Including these will give you a false, slower average and hide your true pace.
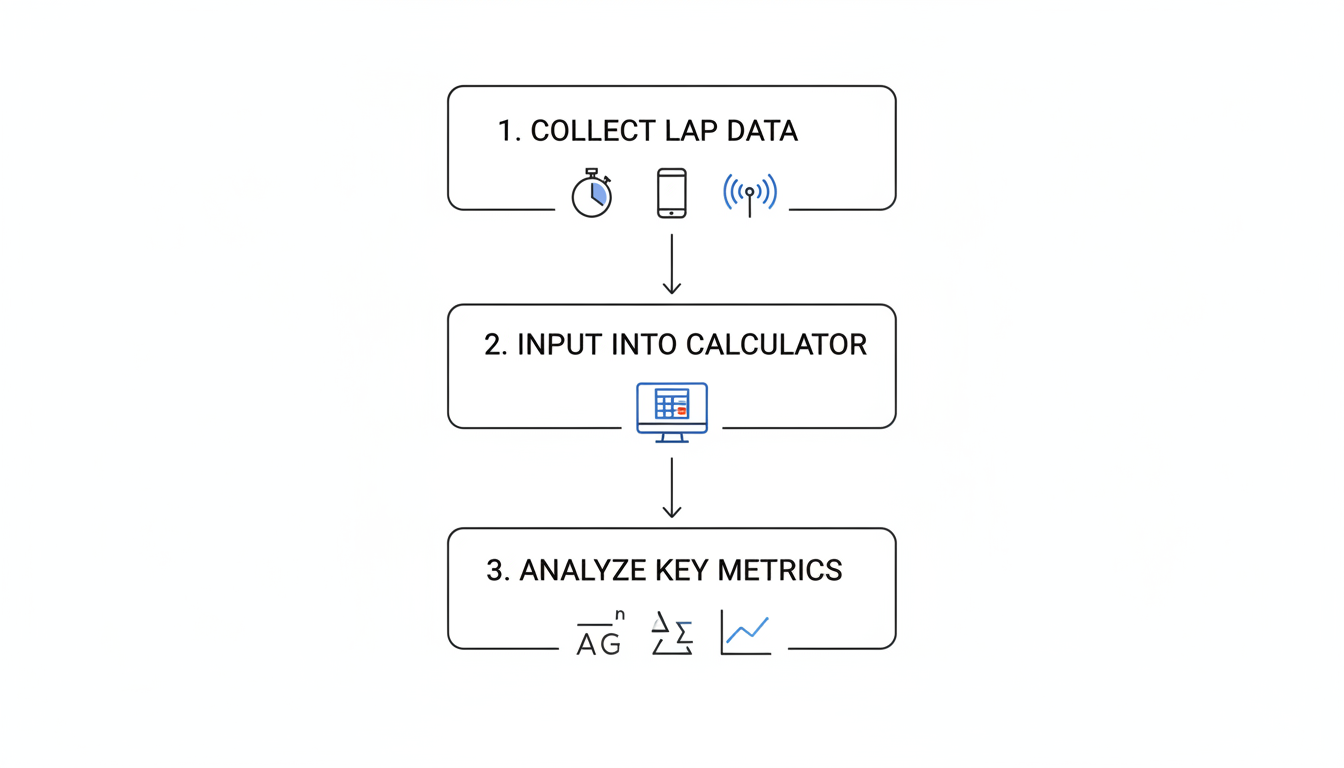
Your Step-by-Step Guide to Finding More Speed
Ready to put this into practice? It’s a simple process, but discipline is key. Follow these steps every single time you’re on track.
Step 1: Collect Clean, Accurate Data
Your analysis is only as good as your data. Garbage in, garbage out. You need a reliable way to log every single lap time.
- Good: A friend with a stopwatch and a notepad. Prone to human error, but better than nothing.
- Better: GPS-based smartphone apps like Harry’s LapTimer or TrackAddict. These are surprisingly accurate and often provide sector data automatically.
- Best: Professional telemetry systems like AiM, MoTeC, or VBOX. These are the gold standard, offering precision down to the hundredth of a second.
Whichever method you use, log the times for a single “stint”—a continuous run of laps without stopping.
Step 2: Input Your Data into the Calculator
This is the easy part. Open your chosen lap time calculator tool and enter the times from your stint. Be meticulous. A single typo (e.g., 1:45.3 instead of 1:35.3) will completely skew your results. Remember to exclude those outlier laps we talked about.
Step 3: Analyze the Output—Become a Data Detective
This is where you find the speed. The calculator will spit out the core metrics. Here’s what to look for:
- Check the Average: This is your new baseline. After your next session, you’ll compare the new average to this one. Is it faster? Slower? This tells you if your changes are working.
- Look at the Delta: What’s the difference between your fastest and slowest (valid) lap? If it’s more than a second or two, you have an inconsistency problem. Ask yourself why. Were you over-driving? Did your focus wander?
- Assess Consistency: If your tool provides a standard deviation, this is your consistency score. A low number is the hallmark of an elite driver. Your goal is to consistently shrink this number session after session.
⚠️ Watch Out
Don’t fall into the trap of only looking at your fastest lap. I’ve seen countless drivers make a setup change, produce one “fluke” fast lap, and declare it a success, even when their average pace got slower. Your average time is the truth-teller.
Common Pitfalls: How Racers Misinterpret Their Data
Having the data is one thing; knowing how to read it is another. Based on real-world coaching, here are the most common mistakes drivers make when they start looking at their times.
“Data is like a joke. If you have to explain it, it’s probably not that good. Your lap times should tell a clear story.”
- Ignoring Context: A 1:55.3 average lap time means nothing without context. Was that on a hot, greasy track in the afternoon with old tires? Or on a cool morning with fresh rubber? Always note the conditions to make fair comparisons.
- Analyzing Too Little Data: Calculating an average from just three laps is statistically useless. You need a solid stint of at least 5-7 timed laps, preferably more, to get a meaningful average.
- Forgetting the “Ideal Lap”: Many advanced tools calculate your “ideal lap” by combining your best sectors from the entire session. This shows your theoretical maximum speed. If your ideal lap is a full second faster than your best lap, it means you’re struggling to string a perfect lap together.
🎯 Key Takeaway
Your goal isn’t just to be fast, it’s to be repeatably fast. Use the lap time calculator to focus on shrinking the gap between your fastest lap and your average lap. That gap is where true, sustainable speed is found.
Advanced Strategies for Serious Competitors
Once you’ve mastered the basics, you can use a lap time calculator for high-level race strategy. This is how professional teams operate, and you can apply the same principles.
Stint-to-Stint Comparison
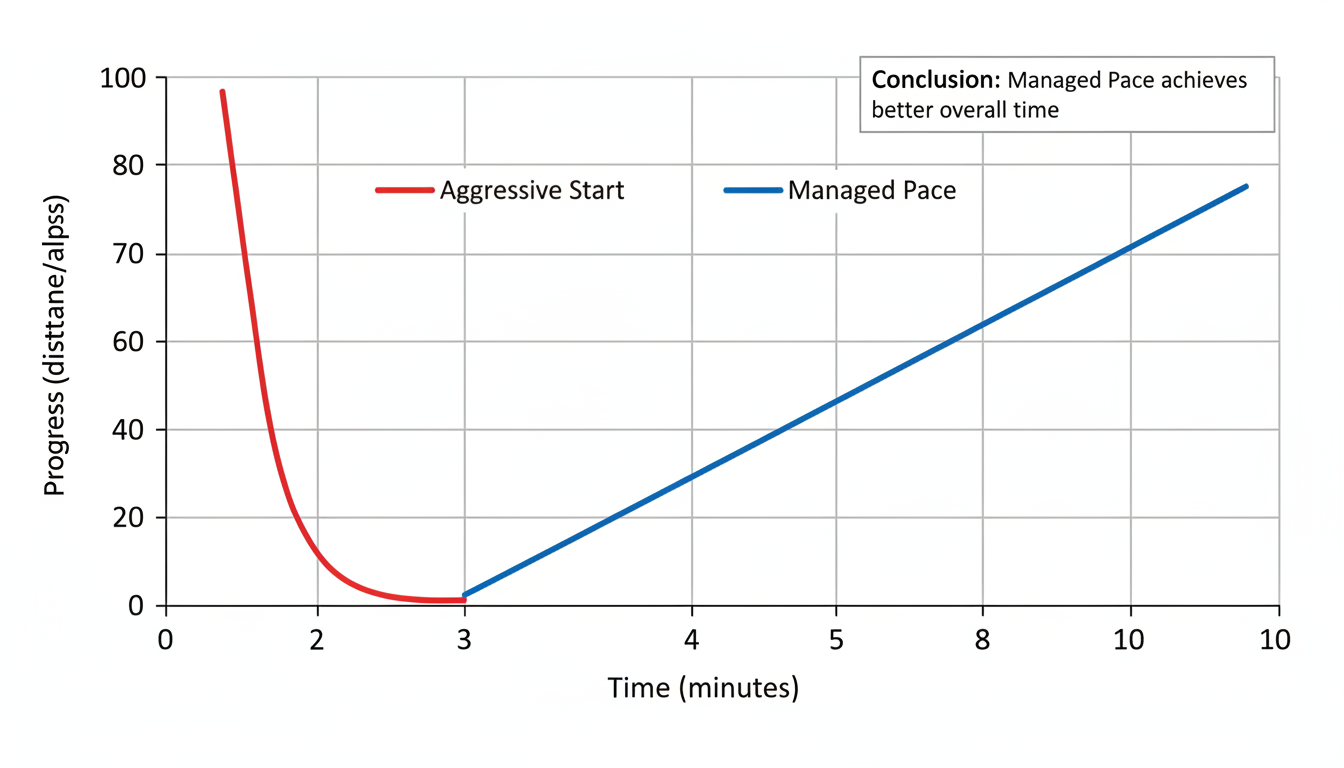
Never analyze a session in isolation. Compare your first stint on new tires to your second stint on older tires. The calculator will show you exactly how much time you lose per lap as your tires degrade. This is mission-critical information for planning pit stops and managing your pace over a long race. According to in-depth analysis of F1 strategy, understanding this “degradation curve” is often the key to victory.
Here’s a typical before-and-after scenario from a driver who started analyzing their tire wear:
| Analysis Point | Before Data Analysis (Guesswork) | After Data Analysis (Informed) |
|---|---|---|
| Tire Strategy | “Push hard until the car feels slow, then pit.” | “Data shows we lose 0.3s/lap after lap 8. We’ll manage pace for 7 laps, then push for 2 before pitting.” |
| Pace Management | Drove at 100% from the start, tires fell off a cliff. | Drove at 98% for the first half of the stint, resulting in a much faster average lap time over the full run. |
| Race Result | Fast early, but overtaken late in the race. Finished 5th. | Consistent pace throughout, held off rivals. Finished 2nd. |
💡 Pro Tip
Use the calculator to compare your data to a teammate or a known fast competitor. This provides an invaluable external benchmark. If their average is faster, but your fastest lap is similar, you know the speed is in you—you just need to unlock the consistency.
⚠️ Watch Out
Be careful when analyzing sector times. Sometimes, going faster in one sector can compromise your entry into the next, making your overall lap slower. For example, braking super late into a slow corner (fast Sector 1) might give you a terrible exit, costing you time all the way down the following straight (slow Sector 2).
It’s Not Just for Cars: Applications Across Disciplines
The principles of lap time analysis are universal. Any sport where performance is measured in timed loops or splits can benefit. The goal is always the same: go faster, more consistently.
- Motorsport (Cars, Bikes, Karts): This is the obvious one. From club racing to the highest levels governed by bodies like the Fédération Internationale de l’Automobile (FIA), data analysis is non-negotiable.
- Sim Racing: The virtual world is hyper-competitive. Sim racers on platforms like iRacing or Assetto Corsa Competizione live and breathe this data to fine-tune setups and find every last thousandth of a second.
- Athletics (Running, Swimming, Cycling): Coaches and athletes analyze “split times” instead of lap times, but the concept is identical. A running coach will use split data from a 5k to identify if the athlete went out too fast and faded at the end.
Conclusion: Stop Driving Fast, Start Driving Smart
In a world of marginal gains, you can’t afford to guess anymore. A lap time calculator is your first and most powerful step into the world of data-driven performance. It’s the tool that turns a confusing jumble of numbers into a clear, actionable plan for improvement.
It teaches you to value relentless consistency over a single moment of glory. It gives you the confidence to make strategic decisions. It provides the unbiased feedback you need to break through performance plateaus.
So, the next time you head to the track, don’t just bring your helmet. Bring a plan. Record your laps, dive into the data, and start the journey to unlocking your true, untapped potential. The stopwatch doesn’t lie.
❓ Frequently Asked Questions
What’s the difference between average lap time and race pace?
They’re closely related. Average lap time is the simple math of your laps in a practice session. “Race pace” is the realistic average you can maintain during an actual race, factoring in fuel load, tire wear, and traffic. The calculator helps you understand your potential race pace by analyzing your practice stints.
How do I measure my lap time consistency?
The best calculators provide a “standard deviation” metric—a low number is better. Manually, you can look at the delta (the gap) between your fastest and slowest valid laps. If you’re running 1:30s and your delta is over 1.5 seconds, you have a consistency issue to work on.
Can I use a lap time calculator for sports like running or swimming?
Absolutely. Any sport with timed circuits or splits can use this analysis. Runners analyze mile splits, swimmers analyze 100m splits. It’s all about understanding pacing, endurance, and consistency, no matter the discipline.
What’s the minimum data I need to get started?
All you need is a clean list of consecutive lap times from a single session (a “stint”). For a meaningful analysis, we recommend at least 5-7 laps. The more data you have, the more accurate your average pace will be.
Is a faster “hero lap” always the goal?
No, and this is a critical point. A blistering qualifying lap is great, but if it destroys your tires and can’t be repeated, it’s useless in a race. A driver who is 0.2s slower but can lap within 0.1s of their average time for 20 laps will almost always beat the driver with one fast lap and a high level of inconsistency.

