Imagine this scenario: You check your investment portfolio and see a loss of 50%. Panic sets in. You tell yourself, “It’s okay, I just need a 50% gain to get back to even.”
Here is the harsh reality: You are wrong.
To recover from a 50% loss, you actually need a 100% gain. If you start with $100 and drop to $50, a 50% increase on that $50 only gets you back to $75. You are still in the hole. This is the power—and the danger—of misunderstanding percent change.
Whether you are a business owner analyzing year-over-year revenue, a marketer tracking conversion rates, or just trying to figure out if that Black Friday deal is actually a steal, raw numbers often lie. They lack context. A $10 discount means nothing without knowing the original price. But a percent change calculation? That tells the whole story.
In this guide, updated for the economic landscape of 2026, we are going to move beyond 5th-grade math. We will dive into the nuances of relative change, explore the seven critical differences between increases and decreases, and look at how these figures shape decisions in finance, health, and business.
📑 What You’ll Learn
The Core Concept: Relative vs. Absolute Change
Let’s get one thing straight immediately. In my years analyzing data for digital campaigns, the biggest error I see isn’t bad math—it’s bad context.
Absolute change is simple subtraction. If your rent goes from $1,000 to $1,100, the absolute change is $100.
Percent change is the ratio. It tells you how significant that $100 is relative to where you started.
Why does this matter? Because a $100 hike on a $1,000 apartment (10%) hurts a lot more than a $100 hike on a $10,000 luxury penthouse (1%). Percent change standardizes the data, allowing us to compare apples to oranges.
🎯 Key Takeaway
Raw numbers describe what happened (e.g., “Revenue is up $5k”). Percent change describes the impact of what happened (e.g., “Revenue grew by 20%”). Always use percentages to gauge performance across different scales.
The Master Formula: How to Calculate Percent Change
You don’t need a fancy financial calculator to get this right. You just need to remember one golden rule: Always divide by the Old Value.
The formula is universal, whether you are tracking stock prices or weight loss:
((New Value – Old Value) ÷ Old Value) × 100 = Percent Change
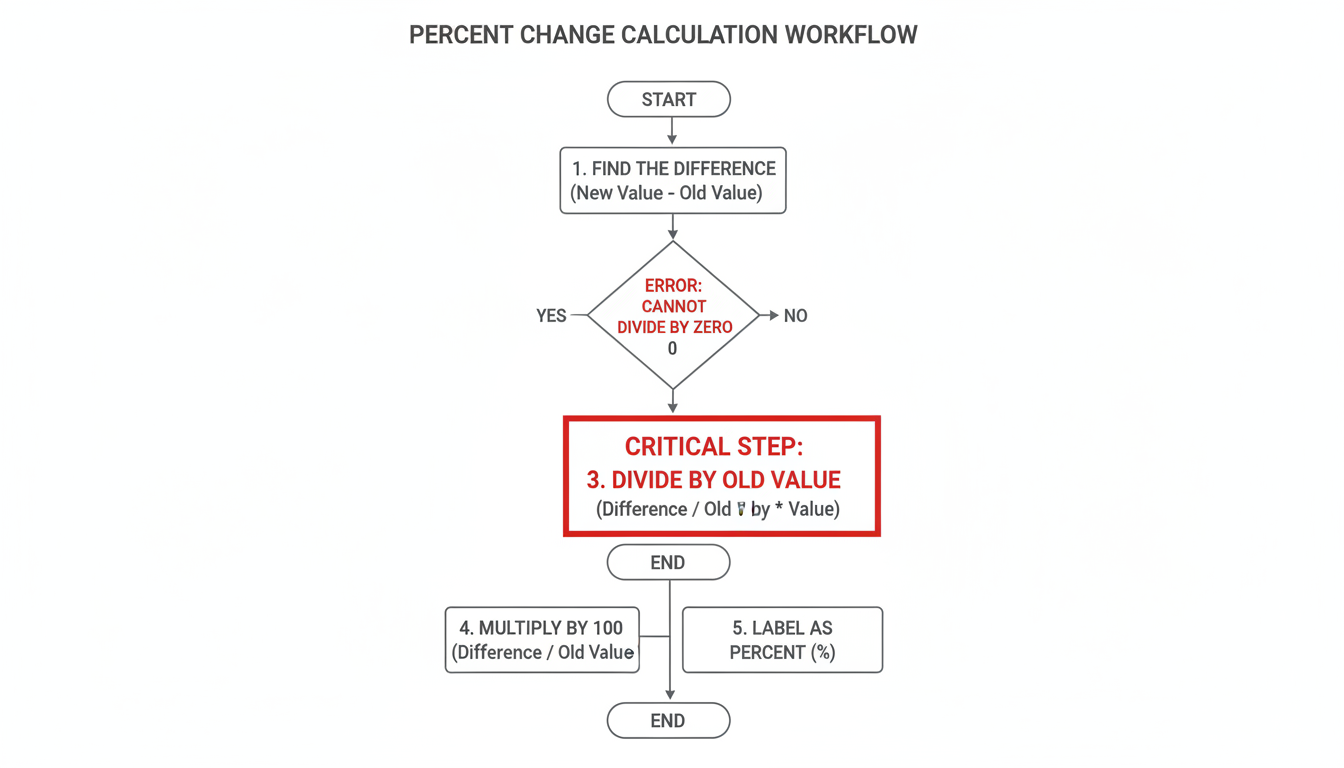
Step-by-Step Guide
- Find the Difference: Subtract the Old Value from the New Value.
- Divide: Take that result and divide it by the Old Value (the starting number).
- Convert: Multiply the decimal by 100 to get a percentage.
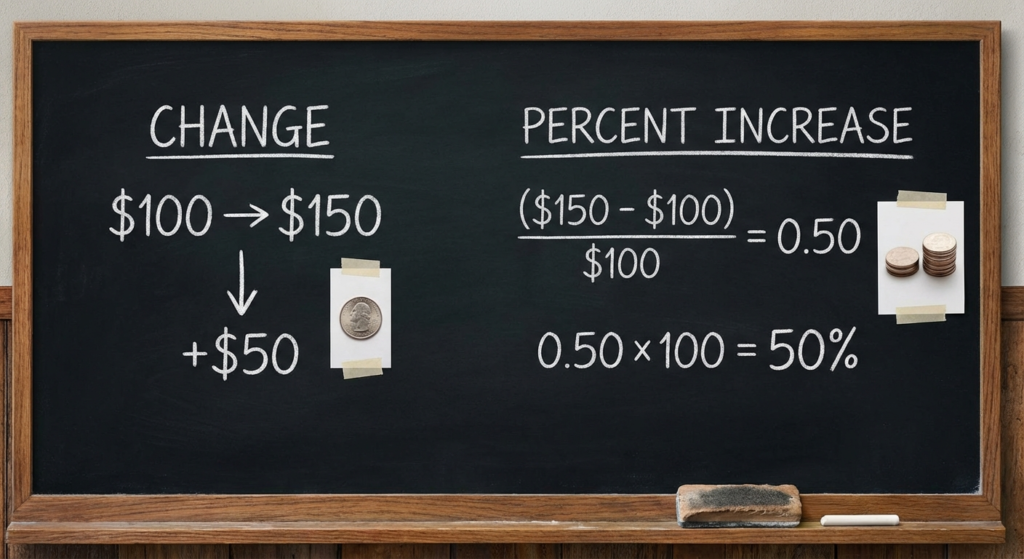
Let’s look at a practical example. Suppose you bought a vintage watch for $200 (Old Value) and sold it for $300 (New Value).
- Step 1: $300 – $200 = $100 (This is the absolute change).
- Step 2: $100 ÷ $200 = 0.5.
- Step 3: 0.5 × 100 = 50%.
You made a 50% profit. Simple, right? But things get tricky when the numbers go down.
💡 Pro Tip
If you are using Excel or Google Sheets in 2026, you don’t need to multiply by 100. Just use the formula =(New-Old)/Old and then click the “%” button in the toolbar. This formats the decimal for you automatically and prevents rounding errors.
7 Key Differences Between Increase and Decrease
While the formula remains the same, the implications of a percent increase versus a percent decrease are vastly different. In our experience working with financial data, treating them as identical is a recipe for disaster.
Here is a breakdown of how they differ fundamentally:
| Feature | Percent Increase 📈 | Percent Decrease 📉 |
|---|---|---|
| Direction | New Value > Old Value | New Value < Old Value |
| Sign | Positive (+) | Negative (-) |
| Limit | Unlimited (can exceed 100%) | Limited (cannot exceed 100% if value > 0) |
| Recovery | Easier to reverse mathematically | Harder to recover from (requires larger % gain) |
| Context | Growth, Inflation, Markup, Profit | Discount, Deflation, Decay, Loss |
| Psychology | Often perceived as “Good” (unless it’s debt) | Often perceived as “Bad” (unless it’s cost) |
| Base Effect | Calculated on a smaller starting number | Calculated on a larger starting number |
Understanding the “Limit” Difference
This is a fascinating nuance. A price can increase by 1,000% (going from $1 to $11). However, a price cannot decrease by 1,000% unless it goes into negative territory (like oil prices did briefly years ago). Generally, the maximum percent decrease for a tangible item is 100% (it becomes free or zero).
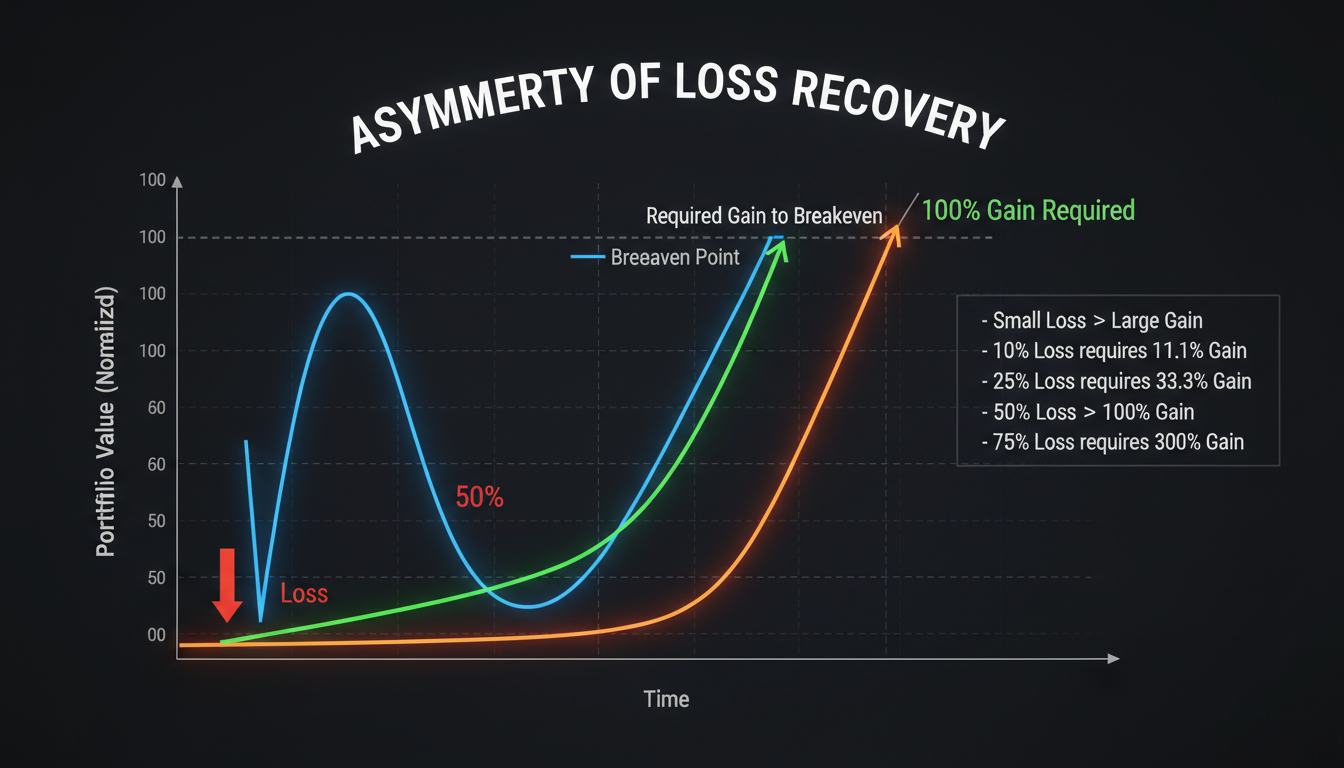
The “Asymmetry Trap” in Finance
I mentioned this in the intro, but we need to dig deeper. This is the single most important concept for investors to grasp.
Percentage changes are not symmetrical. The math works against you when you lose money. This is because your “Old Value” (the denominator) shrinks after a loss.
Check out this recovery table. It shows what percentage gain you need to recover from various losses:
| If You Lose… 🔻 | You Need This Gain to Break Even 🔺 |
|---|---|
| 10% | 11.1% |
| 20% | 25% |
| 30% | 42.8% |
| 50% | 100% (Double your money!) |
| 90% | 900% (Almost impossible) |
This is why Warren Buffett’s first rule of investing is “Never lose money.” The math of percent change makes digging out of a hole incredibly difficult.
⚠️ Watch Out: Common Calculation Mistakes
Even smart people get this wrong. In 2026, with AI tools doing so much for us, manual literacy is dropping. Don’t fall for these traps.
⚠️ Watch Out: The Denominator Error
The most common mistake is dividing by the New Value instead of the Old Value.
Example: A shirt drops from $50 to $40. The difference is $10.
Wrong: 10 / 40 = 25% (This calculates markup from the new price).
Right: 10 / 50 = 20% (This calculates the discount from the original price).
Percentage Points vs. Percent Change
This is a pet peeve of mine when reading the news. If a bank interest rate goes from 1% to 2%, that is not a 1% increase.
- It is a 1 percentage point increase.
- It is a 100% percent change (the rate doubled).
Confusing these two can lead to massive errors in forecasting. For a deeper dive into how these statistics are officially reported, you can check the guidelines from the Bureau of Labor Statistics.
Real-World Applications (2026 Edition)
Why should you care about mastering this? Because it governs the world around you.
1. E-Commerce and Retail
If you run a Shopify store, understanding margins is survival. If your supplier raises costs by 10%, you can’t just raise your prices by 10% to maintain the same margin percentage. You actually have to raise them slightly more. This is the difference between markup and margin, both derived from percent change formulas.
2. Health and Fitness
In health, trends matter more than daily snapshots. Doctors use percent change to track weight loss or gain during pregnancy. A sudden 5% drop in body weight in a month is a major medical red flag, whereas a 5-pound drop might not be significant for a larger person. Context is key.
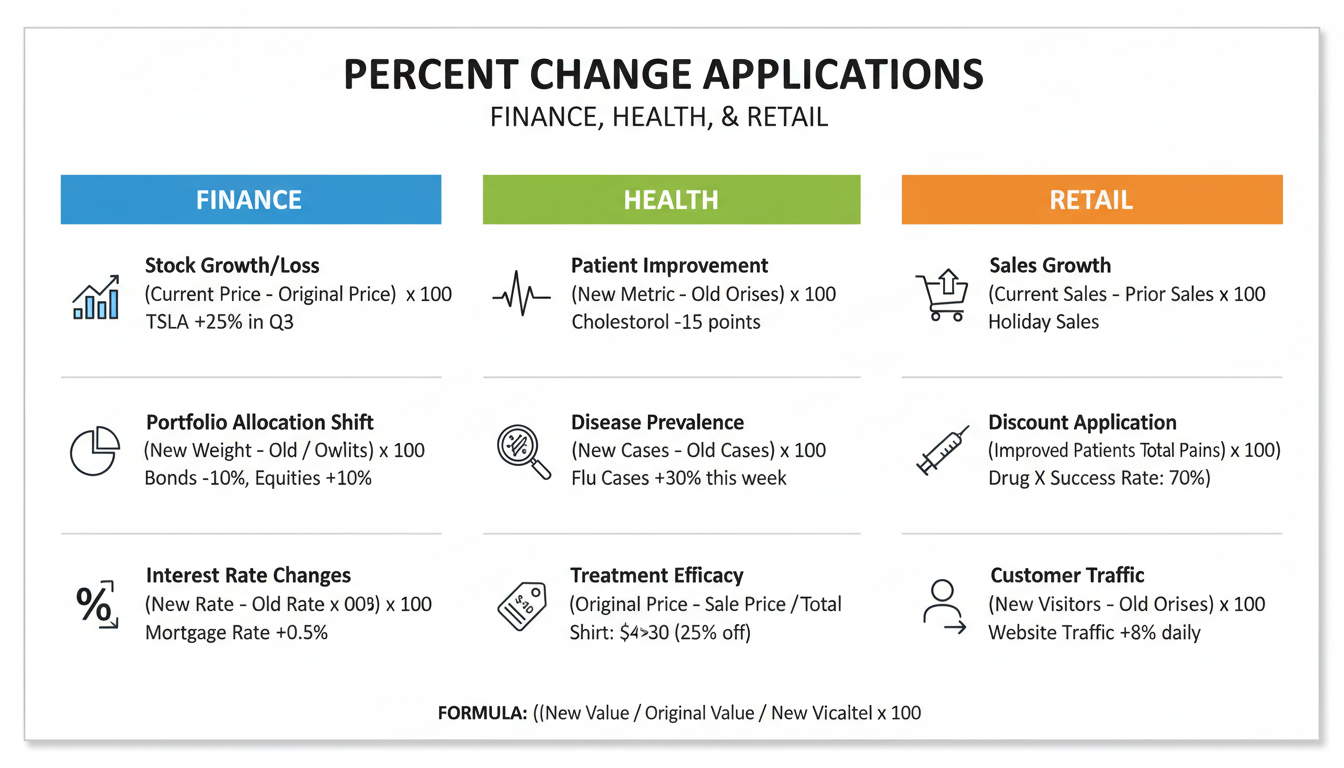
3. Inflation and Salary
If inflation is 3% and your raise was 2%, your “real wage” has a negative percent change. You effectively took a pay cut. Understanding this helps you negotiate better during annual reviews.
❓ Frequently Asked Questions
Can percent change be greater than 100%?
Absolutely. If a value more than doubles, the percent change exceeds 100%. For example, if a crypto coin goes from $1 to $5, that is a $4 increase. $4 divided by $1 is 4, which equals a 400% increase.
How do I calculate percent change if the starting number is zero?
Mathematically, you cannot. Division by zero is undefined. If a company had $0 revenue last year and $100,000 this year, the percent change is technically infinite. In business reports, this is usually marked as “N/A” or “New Entrant.”
Is a negative percent change always bad?
Not at all. It depends on what you are measuring. A negative percent change in debt, overhead costs, or customer churn rate is fantastic. It simply indicates a reduction in the value.
What is the difference between percent change and percent difference?
Percent change implies a timeline (Old vs. New). Percent difference compares two things that exist simultaneously (like the height of two buildings) to see how much they differ relative to their average. For the math behind this, Khan Academy offers excellent tutorials.
Conclusion
Mastering percent change isn’t just about passing a math test; it’s about financial literacy and critical thinking. In a world drowning in data, the ability to quickly calculate whether a shift is a minor blip or a major trend is a superpower.
Remember the golden rule: (New – Old) / Old. Keep an eye on the denominator, watch out for the asymmetry trap in your investments, and never confuse percentage points with percentage change.
Next time you see a headline screaming about a “massive surge” or a “historic drop,” run the numbers yourself. You might find the story is quite different than it appears.
Want to dive deeper into financial metrics? Check out our guide on Compound Interest to see how percent change works over long periods.

